All published articles of this journal are available on ScienceDirect.

Characterization of the Stoichiometry of HMGA1/DNA Complexes
Authors Info & Affiliations
Abstract
High-mobility group A1 (HMGA1) non-histone chromatin architectural transcription factors regulate gene expression, embryogenesis, cell differentiation, and adaptive immune responses by binding DNA and other transcription factors. HMGA1 has also been shown to be highly over-expressed in many human cancers and is considered to be a valuable cancer biomarker. Elevated HMGA1 expression levels also make cancer cells resistant to chemotherapy. Here, HMGA1/DNA complex formation was investigated using electrophoretic mobility shift assays (EMSA). Collectively, the EMSA results indicated that full length HMGA1 mixed with DNA containing three AT-hook binding sites formed four distinct HMGA1/DNA complexes ranging in stoichiometry from 1:2 to 3:1 in HMGA1:DNA ratio. The data indicated that the distribution of complexes with different HMGA1 to DNA stoichiometries depended on the molar ratio of HMGA1 to DNA in solution, which could have significant biological implications given that HMGA1 is highly over-expressed in human cancer cells. The two naturally occurring isoforms of HMGA1, HMGA1a and HMGA1b, the latter containing an 11 amino acid deletion between the first and second AT-hooks, were observed to have slightly different DNA binding profiles. Finally, HMGA1 binding affinity to DNA was found to be influenced by the DNA A:T segment sequence context, with higher specificity be observed in HMGA1 binding to TnAn segments, which have two local minor groove minima on either side of the TpA step, compared to An:Tn segments, which have a single minor groove minimum at the 3' end of the An run, implying AT-hook binding favors narrow minor groove structure.
INTRODUCTION
High-mobility group A1 (HMGA1) proteins are non-histone chromatin architectural transcription factors [1] found broadly among eukaryotes [2]. HMGA1 proteins, which consist of two isoforms, HMGA1a (a.k.a. HMG-I) and HMGA1b (a.k.a HMG-Y) [3, 4], are expressed at high levels in embryonic tissues during early development [5], and at very low levels in normal adult tissues [6]. Loss of HMGA1 expression has been shown to detrimentally affect cell differentiation in embryonic stem cells [7], spermatogenesis [8], and development of type 2 diabetes and hypoglycemia in mice [9]. In chromatin function, HMGA1 proteins are thought to cause DNA destabilization associated with chromatin unfolding during DNA replication [10, 11]. Gene expression regulation is a primary normal function of HMGA1 in adults [6] with HMGA1 proteins involved in both positive and negative regulation of genes responsible for apoptosis, cell proliferation, immune response and DNA repair [12, 13]. One of the most well studied examples of HMGA1 regulation of gene expression involves the interferon-β (IFN-β) gene [14, 15, 16]. IFN-β expression is regulated by a multiple-protein/DNA complex called an enhanceosome [14, 17]. The IFN-β enhanceosome, which forms in the enhancer region upstream of the gene, is composed of multiple transcription factors including NF-κβ, IRF, ATF2/cJun, and HMGA1. In contrast to classical transcription factors that bind specific DNA sequences, HMGA1 acts as an architectural transcription factor [1], which means that it binds a specific type of DNA structure, i.e. the minor groove of A:T tract DNA [18]. As architectural transcription factors, HMGA1 proteins have been suggested to play multiple roles in the formation and function of enhanceosomes including 1) induction of DNA conformational changes that increase the binding of other transcription factors to the regulatory site, 2) binding directly to other transcription factors to stabilize DNA binding, and 3) mediation of indirect interactions between proteins [12].
In addition to their role in regulating adaptive immune responses in human adults, high levels of HMGA1 expression have been reported in almost every type of human cancer [19]. High levels of HMGA1 expression have been shown to give pancreatic cancer cells resistance to chemotherapy, however, suppression of HMGA1 expression by siRNA reestablished sensitivity [20]. While the precise role that HMGA1 plays in cancer is not yet understood, HMGA1 has been suggested as a potential biomarker for tumor development and drug target for cancer therapy [21]. Several cancer therapy drugs, such as FR900482 and FL317, have been designed as competitive inhibitors of HMGA1 binding [22], however, these drugs have shown high toxicity in humans. More recently, transfection of pancreatic cancer cell lines with phosphorothioate DNA aptamers designed to compete with genomic DNA for binding to HMGA1 proteins has been shown to restore sensitivity of the cancer cells to the chemotherapy agent gemcitabine [23].
Early structural studies demonstrated that HMGA1 does not adopt a conventional protein structure composed of alpha helices or beta sheets, but rather binds the minor groove of AT-rich DNA through novel DNA binding motifs referred to as "AT-hooks" [18]. AT-hooks, which are identified by the unique sequence of R-G-R-P [18, 24], adopt a crescent-shaped structure upon binding the minor groove of DNA with the arginine side chains inserting into the minor groove [18, 25]. HMGA1 is expressed as two isoforms, HMGA1a and HMGA1b, which are encoded from the same gene but HMGA1b contains a deletion of 11 amino acid residues between the first and second AT-hook as a result of the alternate splicing [3]. These isoforms have different post-translational modifications in vivo and are suggested to have different biological functions in tumor progression [26]. However, the difference in DNA binding activities between HMGA1a and HMGA1b has not been characterized.
Based on the present understanding of DNA binding activity of HMGA1, each AT-hook binds a minimum stretch of five or six consecutive AT base pairs. The natural substrates of HMGA1 have various lengths and sequences of AT-rich DNA [27]. In the IFN-β enhancer region, there are four potential HMGA1 binding sites, PRDI through PRDIV [17]. Isothermal titration calorimetry experiments have shown the formation of a 1:1 complex with PRDII and also suggested HMGA1 binds to this site with two AT-hooks due to the presence of two AT-hook binding sites [28]. The promoter region of NF-κβ has an HMGA1 binding site spanning a stretch of 19 consecutive adenines (A19) where all three AT-hooks are suggested to bind, and the positive regulatory domains I and II (PRDI and II), which each have five AT base pair segments where one AT-hook could bind [29].
The capability of HMGA1 to regulate gene expression and modulate DNA structure and stability at high concentrations could be important to unraveling its role in carcinogenesis. Since HMGA1 contains three DNA binding motifs each with different DNA affinities [30], it is plausible that several different HMGA1/DNA complexes can form with different stoichiometries when HMGA1 interacts with DNA containing stretches of AT tracts that contain multiple potential AT-hook binding sites. For example, in the presence of excess protein, two or three HMGA1 proteins could potentially bind to one DNA molecule using one AT-hook from each protein. In the presence of excess DNA, HMGA1 would be capable of binding two or three DNA molecules, with each AT-hook binding a different DNA molecule.
In order to establish a better understanding of how the stoichiometry of HMGA1/DNA complexes varies with the ratio of HMGA1 to DNA in solution, we performed a series of electrophoretic mobility shift assays (EMSA) using DNA oligomers containing one, two or three AT-hook binding sites and a construct of HMGA1 that contained all three AT-hooks. The EMSA results indicated formation of four distinct complexes with stoichiometries ranging from 1:2 to 3:1 in HMGA1:DNA ratios. Our results demonstrated that the distribution of HMGA1/DNA complexes with differing stoichiometry was sensitive to the ratio of HMGA1 to DNA concentrations in solution. Furthermore, our studies revealed that the two HMGA1 isoforms, HMGA1a and HMGA1b, exhibited slightly different DNA binding behaviors, with the HMGA1b isomer exhibiting somewhat higher apparent DNA binding affinity. Finally, it was found that HMGA1 DNA binding was influenced by AT-stretch sequence context with tighter apparent binding observed in TnAn sequences, which have two local minima on either side of the TpA step, in comparison to An:Tn sequences, which have only a single local minimum in minor groove width towards the 3' end of the An run. Thus, the AT-hook binding motif appears to exhibit higher affinity and preference for narrow minor groove structures.
MATERIALS AND METHODS
Plasmid Construction
Deletion mutants of human HMGA1 were generated by PCR using following primers: 5'-GCCCGCTCGAGCTASC TCCAGTTTTTTGGGTCTGAAC-3' and 5'-ATCGACTCG AGCTACTCCAGTTTTTTGGGTCTGCC-3'. PCR products were digested with NdeI and XhoI, purified from agarose gel by using gel extraction kit (Qiagen), and then cloned into pET-30b vector. Mutants were verified by DNA sequencing. The constructs used in the experiments are summarized in Fig. (1).
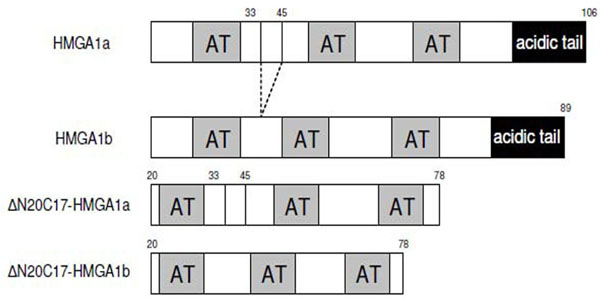
Schematic representation of the sequences of HMGA1 isoforms and deletion mutants used in this study.
Protein Expression and Purification
The deletion mutants, ΔN20C17-HMGA1a and ΔN20C17-HMGA1b, were expressed in E.coli BL21 (DE3). Cell culture growth was monitored by measuring the OD600. At OD600 between 0.8 to 1.0, protein expression was induced by the addition of 1mM IPTG and incubated at 37°C for 4-6 hours. Deletion mutants of HMGA1a and HMGA1b were purified as described previously [31]. The proteins were further purified with Sephadex G-25 in H2O and lyophilized. The extinction coefficients of ΔN20C17-HMGA1a and ΔN20C17-HMGA1b at 220 nm were determined to be ε 220 = 63,530 M-1cm-1 and ε 220 = 56,300 M-1cm-1 by UV spectrophotometry and amino acid analysis (Purdue University). The samples were resolublized in appropriate buffer for analysis.
Electrophoretic Mobility Shift Assay (EMSA)
The following oligonucleotides were purchased from Integrated DNA Technologies (Coralville, IA, USA): A19 5'- CCC(A)19CC-3', A18 5'- CCC(A)18CC -3', A9T9 5'-CGAAAAAAAAATTTTTTTTTCG-3', T9A9 5'-GCTTTT TTTTTAAAAAAAAAGC-3', A15 5'- CCC (A)15CC-3', A5T5 5'-CGAAAAATTTTTCG -3', A3T3 5'-CGAAATTT CG-3', A5 5'-GGCCCCGCGAAAAACCCGGCGGG-3'. These samples were resuspended and annealed in 100mM NaCl 10mM MgCl2. Protein samples were prepared in 25 mM Tris-HCl (pH 6.5) 50 mM NaCl and the concentrations were determined based on UV 220 nm absorbance. Protein was mixed with DNA according to the ratio indicated and incubated at 4°C for 15 min prior to gel analysis. The protein-DNA complexes were resolved on a 7% polyacrylmide gel and run with TAE buffer at 20 mA for 2-3 h at 4 °C. The 4-20 % precast TBE polyacrylamide gradient gel (Bio-Rad, Hercules, CA) was used for HMGA1 titration with A3T3 DNA. The gels were stained with ethidium bromide and visualized using an AlphaImager (Alpha Innotech, San Leandro, CA). The same gels were further stained with Coomassie blue and visualized using the AlphaImager.
RESULTS AND DISCUSSION
Several HMGA1 constructs, including two different isoforms and several deletion mutants, were used in EMSA experiments (Fig. 1). Considering the nature of the HGMA1 AT-hook DNA binding motif, we anticipated that several HMGA1/DNA complexes could potentially form in the study presented here, each with a different stoichiometry, and these different possible complexes are schematically summarized in Fig. (2). Multiple approaches were used to determine the composition and stoichiometry of each band in the EMSA experiments, as described below.
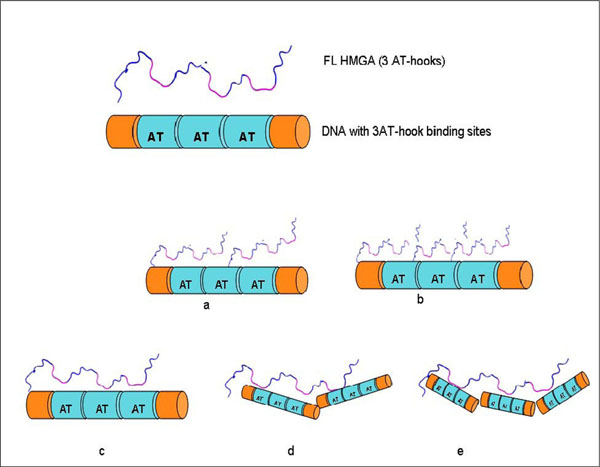
Some potential HMGA1/DNA complexes that might form between full length HMGA1 containing three AT-hooks and DNA containing three AT-hook binding sites: (a) HMGA1:DNA (2:1), (b) HMGA1:DNA (3:1), (c) HMGA1:DNA (1:1), (d) HMGA1:DNA (1:2), (e) HMGA1:DNA (1:3).
Determination of the Stoichiometry of Binding of a Recombinant Deletion Mutant of HMGA1a to DNA Containing Various Length AT Segments
Complexes of ΔN20C17-HMGA1a bound to DNA were studied after incubating DNA samples with increasing amounts of ΔN20C17-HMGA1a (Fig. 3). DNA substrates contained different lengths and sequences of AT segments. The A19-DNA sequence (5'-CCCAAAAAAAAAAAAAA AAAAACC-3') is found upstream of the IL-2Rα gene and was considered representative of a native HMGA1 substrate. In the presence of DNA containing three AT-hook binding sites, e.g. A19-DNA and A18-DNA (5'-CCCAAAAAAAAA AAAAAAAAACC-3'), four distinct DNA/HMGA1a complexes were detected that had different EMSA mobilities in ethidium bromide stained polyacrylamide gels (Fig. 3A and 3B, designated α1-α4). Two higher mobility shifted species, α1 (present in Fig. 3A, lanes 2-7) and α2 (present in Fig. 3A, lanes 2-8), were the primary species detected in titrations ranging from 1:2 to 2:1 molar ratios of ΔN20C17-HMGA1a to A19-DNA. It also appeared that the intensity of the α2 band increased with increasing ΔN20C17-HMGA1a concentration up to about a 2:1 molar ratio of ΔN20C17-HMGA1a to A19-DNA (Fig. 3A, lanes 3-7) while the α1 band depleted with increasing ΔN20C17-HMGA1a concentration beyond a ΔN20C17-HMGA1a to DNA molar ratio of greater than 1.5:1 (Fig. 3A, lanes 5-7). In the presence of more than two-fold excess ΔN20C17-HMGA1a, two lower mobility shifted species, α3 and α4, appeared and grew stronger with increasing ΔN20C17-HMGA1a concentration while the intensity of the α1 and α2 bands decreased (Fig. 3A, lanes 6-9).
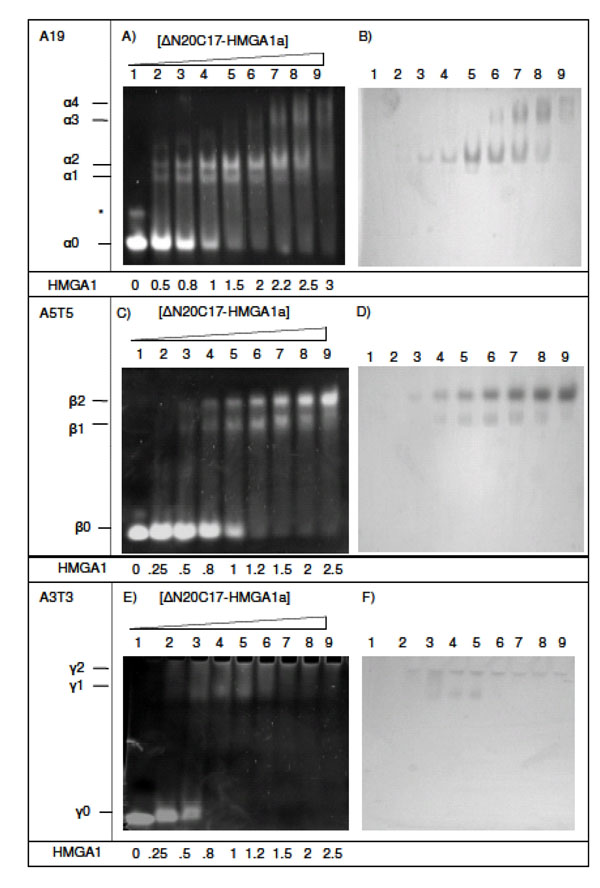
EMSA of ΔN20C17-HMGA1a DNA binding activity. (A, B) EMSA of ΔN20C17-HMGA1a with A19-DNA, (C, D) A5T5-DNA, (E, F) with A3T3-DNA, (G, H) A9T9-DNA and T9A9-DNA, (I, J) A18-DNA and A5-DNA. All gels were stained either with ethidium bromide (left) or Coomassie blue (right). The molar ratio of ΔN20C17-HMGA1a to DNA in each lane is indicated below the gel on the left.
Observation of multiple bands in the EMSA following incubation of ΔN20C17-HMGA1a with the A19-DNA sequence indicated formation of multiple complex species that differed only in the relative stoichiometry of ΔN20C17-HMGA1a and A19-DNA. In Fig. (2), we demonstrate that, based on the number of AT-hooks present in ΔN20C17-HMGA1a and the number of AT-hook binding sites in A19-DNA, at least five possible complexes could form. As mentioned above, we were able to detect four distinct complexes in the ΔN20C17-HMGA1a titration with A19-DNA, indicating that were not able to detect one of the five complexes shown in Fig. (2). Since ΔN20C17-HMGA1a was titrated into a solution of a constant concentration of A19-DNA, the solutions in the early titration points contained an excess of A19-DNA in comparison to ΔN20C17-HMGA1a. From the combined examination of the intensities of the bands in the ethidium bromide and Coomassie stained gels, we concluded that the 1:3 ΔN20C17-HMGA1a to A19-DNA complex was not detected and that the two higher mobility shifts, α1 and α2, were the 1:2 and 1:1 ΔN20C17-HMGA1a to A19-DNA complexes, respectively. This stoichiometry assignment was based on the following observations. First of all, the α2 complex was the predominant species, and presumably the most favorable complex, in solution across most of the titration. We concluded that the α2 species, putatively the 1:1 ΔN20C17-HMGA1a to A19-DNA complex, was the most thermodynamically favorable complex based on both entropic considerations, i.e. only two molecules would have to come together to form this complex, and based on steric considerations, i.e. there would be the smallest steric conflicts in forming a 1:1 ΔN20C17-HMGA1a to A19-DNA complex. Secondly, the higher mobility species, i.e. α1 in the ethidium bromide stained gel (Fig. 3A, lane 3), would be expected to have higher overall negative charge in the complex compared to the lower mobility α2 complex, and therefore the higher mobility α1 complex should contain a higher DNA content compared to the lower mobility α2 complex. Thirdly, inspection of lane 3 in the Coomassie stained gel (Fig. 3B, lane 3) showed that the lower mobility α2 band complex had higher protein content (darker staining) compared to the higher mobility α1 band complex. All of these observations were consistent with assignment of the α2 band to a 1:1 ΔN20C17-HMGA1a to A19-DNA complex and the α1 band to a 1:2 ΔN20C17-HMGA1a to A19-DNA complex. The calculated sizes of the 1:2 and 1:1 ΔN20C17-HMGA1a to A19-DNA complexes are 39.5 kDa and 23.7 kDa respectively, however, the fact that the 1:2 ΔN20C17-HMGA1a to A19-DNA complex would have a greater overall negative compared to the 1:1 ΔN20C17-HMGA1a to A19-DNA complex resulted in higher mobility shift in the native PAGE experiments. The mobility of the ΔN20C17-HMGA1a to A19-DNA complex was therefore dominated by the overall charge of the complex rather than the size of the complex. Therefore, from all of these considerations, it was concluded that the α1 band represented the 1:2 ΔN20C17-HMGA1a to A19-DNA complex (Fig. 2D) and the α2 band represented the 1:1 ΔN20C17-HMGA1a to A19-DNA complex (Fig. 2C).
The lower mobility shifts in Figs. (3A and 3B) (α3 and α4) were identified as 2:1 (Fig. 2A) and 3:1 (Fig. 2B) ΔN20C17-HMGA1a to A19-DNA complexes, respectively. The predicted molecular weights of 2:1 and 3:1 ΔN20C17-HMGA1a to A19-DNA complexes are 31.6 kDa and 39.5 kDa, respectively. However, these complexes are predicted to have substantially less overall negative charge compared to the higher mobility 1:2 and 1:1 ΔN20C17-HMGA1a to A19-DNA complexes, which is the dominant factor responsible for their reduced EMSA mobility compared to the 1:2 and 1:1 ΔN20C17-HMGA1a to A19-DNA complexes. The lower overall net negative charge in the 2:1 and 3:1 ΔN20C17-HMGA1a to A19-DNA complexes results from multiple HMGA1a proteins, which have an isoelectric point of around pH 10, binding to a single A19-DNA molecule. Formation of multiple ΔN20C17-HMGA1a to A19-DNA HMGA1a complexes in the presence of excess HMGA1a was verified by comparing EMSA results for ΔN20C17-HMGA1a binding to two different DNA sequences having the same length of DNA but different numbers of AT-hook binding sites. Specifically one DNA sequence had only one AT-hook binding site, i.e. A5-DNA in Figs. (3I and 3J), and the other sequence had three AT-hook binding sites, i.e. A18-DNA in Figs. (3I and 3J). In the presence of A18-DNA, which is 23 base pairs long, the high mobility shifted bands, α1 and α2, were observed in lanes 2-4 in Figs. (3I and 3J) (as with the A19-DNA in Figs. (3A and 3B) in lanes 2-8) and the lower mobility α3 and α4 shifted bands were also observed in lane 5 in Figs. (3I and 3) (as with the A19-DNA in Figs. (3A and 3B) in lanes 7-9). However, the EMSA results for ΔN20C17-HMGA1a to A19-DNA binding to the A5-DNA (5'- GGCCCCGCGAAAAACCCGGCGGG -3'), also 23 base pairs long like the A18-DNA but with only one AT-hook binding site, showed formation of the two high mobility α1 and α2 bands, but no low mobility α3 or α4 bands were detectable in the presence of excess HMGA1a (Figs. 3I and 3J, lane 10). These results support the conclusion that the α3 and α4 bands correspond to complexes consisting of multiple ΔN20C17-HMGA1a proteins binding to a single AT18- or AT-19 DNA molecule. First of all, since the AT18-DNA and AT19-DNA molecules have multiple AT-hook binding sites, whereas the AT5-DNA molecule has only a single AT-hook binding site, it would be feasible for the 1:2 and 1:1 ΔN20C17-HMGA1a to AT5-DNA complexes to form but it would not be feasible to form the 2:1 and 3:1 ΔN20C17-HMGA1a to AT5-DNA complexes since the AT5-DNA only contains a single AT-hook binding site. Formation of complexes containing multiple ΔN20C17-HMGA1a bound to a single DNA molecule with more than one AT-hook binding site in the presence of excess HMGA1a is consistent with the fact that the different AT-hooks in ΔN20C17-HMGA1a have different DNA binding affinities. It has been shown that the second and third AT-hooks have a much higher binding affinity (nanomolar) compared to the first AT-hook (micromolar) [30]. Thus, in the presence of an excess of HMGA1, every high affinity AT-hook in ΔN20C17-HMGA1a protein could potentially bind to its own unique DNA substrate.
HMGA1a Binding to DNA with Two AT-Hook Binding Sites
To further clarify the stoichiometries of complexes formed by ΔN20C17-HMGA1a binding to DNA substrates, EMSA experiments were conducted using a DNA substrate containing two AT-hook binding sites, i.e. A5T5 (5'-CGAAAAATTTTTCG -3'). When ΔN20C17-HMGA1a was incubated with A5T5 DNA, two ΔN20C17-HMGA1a A5T5 species were observed corresponding to a high mobility complex (β1) and a low mobility complex (β2) (Figs. 3C and 3D, lanes 3-9). Both shifted bands, β1 and β2, were present until the concentration of HMGA1a was increased to more than two-fold excess in comparison to A5T5-DNA, after which a decrease in the intensity of the high mobility β1 shifted band and an increase in the intensity of the low mobility β2 shifted band was observed (Figs. 3C and 3D, lane 8-9). By a similar analysis as described above, the β1 and β2 shifted bands were identified as 1:2 and 1:1 ΔN20C17-HMGA1a to A5T5-DNA complexes, respectively. As above, it was expected that the higher mobility β1 shifted band represented a ΔN20C17-HMGA1a to A5T5-DNA complex that had a higher overall negative net charge in the complex compared to the lower mobility β2 complex (Fig. 3C). Also, as can be seen in Fig. (3D), the lower mobility β2 ΔN20C17-HMGA1a to A5T5-DNA complex had a higher relative ΔN20C17-HMGA1a content compared to the lower mobility β1 complex. These observations are both consistent with the higher mobility β1 species representing a 1:2 complex ΔN20C17-HMGA1a to A5T5-DNA complex and the lower mobility β2 species representing a 1:1 ΔN20C17-HMGA1a to A5T5-DNA complex. At greater than two-fold excess of ΔN20C17-HMGA1a to A5T5-DNA, there could be formation of complexes composed of multiple ΔN20C17-HMGA1a proteins bound to a single A5T5-DNA molecule, however, such complexes were not detectable in these EMSA experiments, likely because they could not migrate into the gel given their increasingly positive overall charge.
HMGA1a Binding to DNA with one AT-Hook Binding Site
To complete our analysis of ΔN20C17-HMGA1a binding to DNA molecules containing differing numbers of AT-hook binding sites, EMSA experiments were conducted for ΔN20C17-HMGA1a binding to a DNA substrate containing a single AT-hook binding site, namely A3T3 (5'-CGAAATTTCG-3'). For these EMSA experiments, solutions of the complexes between ΔN20C17-HMGA1a and A3T3-DNA had to be analyzed using a 4-20% polyacrylamide gradient gel due to the low mobility of the complexes in a 7% native gel (Fig. 3E and F). The low electrophoretic mobility of the complexes between ΔN20C17-HMGA1a and the A3T3-DNA was consistent with diminishing overall net negative charge on the complex once ΔN20C17-HMGA1a bound to the short ten base pair A3T3-DNA molecule. Beyond a 1:2 molar ratio of ΔN20C17-HMGA1a to A3T3-DNA, all the A3T3-DNA was shifted primary into a single high mobility shifted band, γ1, presumably consisting of a 1:2 ΔN20C17-HMGA1a to A3T3-DNA molar ratio, plus a barely visible γ2 band. Presumably, higher order ΔN20C17-HMGA1a to A3T3-DNA complexes formed but failed to migrate into the gel, since at high ΔN20C17-HMGA1a to A3T3-DNA molar ratios there was no detectable protein other than in the γ1 shifted band in the Coomassie stained gel (Fig. 3F, lanes 6-9).
HMGA1a Binding Activity Depends on AT Tract Sequence Context
The dependence of ΔN20C17-HMGA1a binding on AT-DNA sequence context was also explored, and slightly different binding behavior of ΔN20C17-HMGA1a was observed when two different DNA sequences having identical AT content but different AT sequences were used. For this experiment, the following two DNA sequences A9T9-DNA (5'-CGAAAAAAAAATTTTTTTTTCG-3') and T9A9-DNA (5'-GCTTTTTTTTTAAAAAAAAAGC -3'), were used (Fig. 3G and H). At a 1.5:1molar ratio of ΔN20C17-HMGA1a to T9A9-DNA, the α2 band (Fig. 3G, lane 9) was dominant, whereas with A9T9 and A18 DNA, both α1 and α2 bands were equally strong (Fig. 3G, lane 4). These results indicated that the DNA binding affinity of ΔN20C17-HMGA1a could be influenced by AT-segment sequence context. It is well known that the DNA minor groove width is sensitive to DNA sequence [32], with self complementary sequences such as AAAAATTTTT reaching a local minimum in minor groove width at the central ApT step [33], whereas in sequences like TTTTTAAAAA, there is a local maximum in minor groove width at the TpA step, and two local minima on either side of the TpA step [32, 34, 35, 36, 37]. Poly An:Tn sequences, like AAAAAAAAAA:TTTTTTTTTT exhibit a narrow minor groove structure at the 3' end of the An stretch, however, the minor groove width does not reach the narrow magnitudes observed either in AnTn or TnAn sequences. Consequently, local variations in minor groove width appear to influence the AT-hook binding affinity and, specifically, the data suggest that the AT-hook motif has a higher affinity and specificity for narrow minor groove structure since the sequence containing two narrow minor groove regions, T9A9-DNA, exhibited tighter HMGA1 binding compared to a sequence with a single and less narrow minor groove region, i.e. A9T9-DNA.
Comparison of HMGA1a and HMGA1b DNA Binding Activities
EMSA experiments were repeated using the HMGA1b isoform in order to compare with the DNA binding activity of HMGA1a (Fig. 4). In the presence of A19-DNA, four different ΔN20C17-HMGA1b/A19-DNA complexes were observed. When the molar ratio of ΔN20C17-HMGA1b to DNA was 1.5:1 in the solution, the 1:1 complex (α2) (Fig. 4A, lane 4 band) was dominant compared to the amount of 1:1 ΔN20C17-HMGA1a to A19-DNA complex in solution at the same protein to DNA ratio (Fig. 3A lane 5 α2 band). Similar results were observed for ΔN20C17-HMGA1b binding to the A5T5 DNA (Fig. 4C). Even though two shifts were observed for ΔN20C17-HMGA1b binding to the A5T5-DNA, as with ΔN20C17-HMGA1a binding, in the case of the A5T5-DNA experiments the β1 band was very faint and the β2 band was clearly dominant compared to in the ΔN20C17-HMGA1a experiment (Fig. 3C lane 5 and Fig. 4C lane 4). In both the A19-DNA and A5T5-DNA binding assays using ΔN20C17-HMGA1b, the formation of 1:1 complexes was dominant compared to the 2:1 complex.
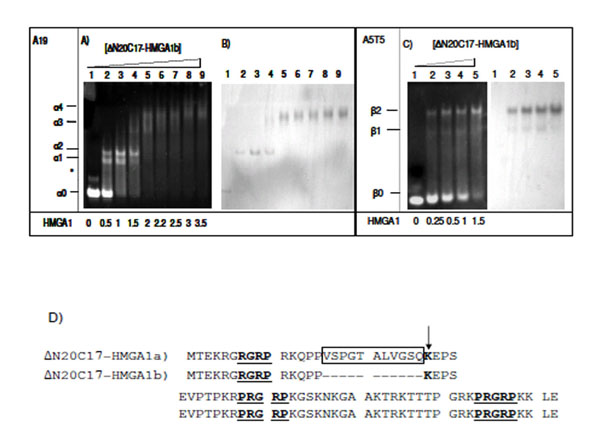
EMSA of ΔN20C17-HMGA1b with A19-DNA (A, B), and A5T5-DNA (C). Amino acid sequence of HMGA1a and HMGA1b deletion mutants (D). The AT-hook sequences are underlined and labeled. In ΔN20C17-HMGA1a, the insert sequence is indicated, and in ΔN20C17-HMGA1b, the deletion of the insertion region (boxed) results in a lysine residue (arrow) being to close to first AT-hook (underlined). The molar ratio of ΔN20C17-HMGA1b to DNA in each lane is indicated below the gel on the left.
In ΔN20C17-HMGA1a, the first AT-hook has been shown to have the weakest DNA binding affinity of the three AT-hooks [29, 38]. This appears to be due to the lack of positively charged amino acid residues flanking the R-G-R-P sequence. However, deletion of 11 amino acids in the insertion region of HMGA1b places the lysine residue closer to the first R-G-R-P sequence (Fig. 4D). In addition, the lack of 11 amino acids brings two AT-hooks closer together, which may result in increased DNA binding affinity of ΔN20C17-HMGA1b. These differences, in addition to the EMSA results, suggest that HMGA1 isoforms have subtle differences in DNA binding affinity.
CONCLUSIONS
Historically, EMSA studies of HMGA1 binding to DNA have been complicated to interpret because of the several possible HMGA1/DNA complex species that can form, differing only in stoichiometry, and often the precise stoichiometry of all of the bands is not specified, or even discussed. In the work presented here, not only have we demonstrated that the stoichiometry of HMGA1/DNA complexes depends sensitively on their relative molar ratios in solution, with several distinct species potentially forming both in vitro and in vivo depending on the ratio of protein to DNA, but we have also attempted to identify the precise stoichiometry of every band observed in the EMSA experiments. Furthermore, we have demonstrated, for the first time, that HMGA1 DNA binding is modulated by AT:stretch sequence context, with HMGA1 exhibiting tighter binding to TpA DNA sequences compared to An:Tn sequences, indicating that HMGA1 has a preference for binding to narrow minor groove structures. We have also demonstrated for the first time that the two naturally occurring isoforms of HMGA1, HMGA1a and HMGA1b, exhibit slightly different DNA binding affinities, which can be explained by considering the sequence of the amino acids flanking AT-hooks.
FUNDING
This work was supported by start-up funds to MAK.
CONFLICT OF INTEREST
The authors confirm that this article content has no conflicts of interest.
ABBREVIATIONS
| EMSA | =electrophoretic mobility shift assay |
| HMGA1 | =high-mobility group A1 |
| IFN-β | =interferon-β |
| PAGE | =polyacrylamide gel electrophoresis |
ACKNOWLEDGEMENTS
The authors would like to acknowledge the support of Miami University and the Ohio Board of Regents for support of the Ohio Eminent Scholar Laboratory. In addition, MW thanks KNW and MW for invaluable assistance.
REFERENCES
[PubMed Link]
[PubMed Link] [PMC Link]
[PubMed Link]
[PubMed Link] [PMC Link]
[PubMed Link] [PMC Link]
[PubMed Link]
[PubMed Link] [PMC Link]
[PubMed Link] [PMC Link]
[PubMed Link]
[PubMed Link]
[PubMed Link] [PMC Link]
[PubMed Link] [PMC Link]
[PubMed Link]
[PubMed Link] [PMC Link]
[PubMed Link] [PMC Link]
[PubMed Link]
[PubMed Link]
[PubMed Link] [PMC Link]
[PubMed Link]
[PubMed Link] [PMC Link]