Systematic Comparison of Crystal and NMR Protein Structures Deposited in the Protein Data Bank
Abstract
Nearly all the macromolecular three-dimensional structures deposited in Protein Data Bank were determined by either crystallographic (X-ray) or Nuclear Magnetic Resonance (NMR) spectroscopic methods. This paper reports a systematic comparison of the crystallographic and NMR results deposited in the files of the Protein Data Bank, in order to find out to which extent these information can be aggregated in bioinformatics. A non-redundant data set containing 109 NMR – X-ray structure pairs of nearly identical proteins was derived from the Protein Data Bank. A series of comparisons were performed by focusing the attention towards both global features and local details. It was observed that: (1) the RMDS values between NMR and crystal structures range from about 1.5 Å to about 2.5 Å; (2) the correlation between conformational deviations and residue type reveals that hydrophobic amino acids are more similar in crystal and NMR structures than hydrophilic amino acids; (3) the correlation between solvent accessibility of the residues and their conformational variability in solid state and in solution is relatively modest (correlation coefficient = 0.462); (4) beta strands on average match better between NMR and crystal structures than helices and loops; (5) conformational differences between loops are independent of crystal packing interactions in the solid state; (6) very seldom, side chains buried in the protein interior are observed to adopt different orientations in the solid state and in solution.
INTRODUCTION
Most of the protein three-dimensional structures deposited in the Protein Data Bank (PDB) [1, 2] were determined with two experimental techniques, X-ray crystallography and NMR spectroscopy. The majority of the PDB entries are crystal structures (about 86%) and nearly all the others are NMR structures (about 14%).
However, in bioinformatics, particularly whenever structural trends are searched for, it is quite common to ignore the PDB entries produced with NMR spectroscopy. For example to study the side chain conformations [3] as well as to analyze the reliability of distance dependent pair potentials [4], only the high-resolution crystal structures were used. NMR structures were also ignored in studies focused on atom and residue dimensions [5, 6], and for example in the geometry based classification of the Ig-like repeats of human filamin [7], of the Cu, Zn-superpoxide dismutases [8], and of the NAD(P)-binding proteins [9]. Even information of conformational disorder was often inferred from crystal structures rather than from NMR data [10].
There are several reasons for avoiding one to mix crystal and NMR structures in bioinformatics. First, until relatively recently NMR structures represented only a very tiny fraction of the known protein structures so it was costless to disregard them. Second, the samples analyzed by X-ray diffraction and NMR spectroscopy are in different physico-chemical phases, solid state and solution, respectively. Third, in crystallography the atom positions are determined from electron density maps while the NMR experiments produce inter-atomic distances constraints which are afterwards fitted to a molecular model. Moreover, it is commonly accepted that X-ray structures are more precise than NMR structures, independently of the crystallographic resolution. It is thus not surprising that X-ray crystal structures and NMR structures have been segregated into different sets in most of the bioinformatics analyses. Actually, crystal and NMR structures have been considered as complementary source of information about the structure and dynamics of biological macromolecules [11-18].
Despite that, in a number of studies addressing particular molecules, comparisons between NMR and X-ray structures have been performed [17, 19-42]. In general, early reports were focused essentially on generic analyses and were needed to assess the accuracy of the first NMR structures (see for example reference [19]). Later on, NMR structures were compared to crystal structures in order to understand biological properties, by exploiting the fact that the structure in solution may furnish information which is complementary to that given by the solid state structure. For example in the case of retinol-binding protein II the access to the binding cavity determined on the base of crystallographic data [43] was confirmed by successive NMR analysis [33, 44] which revealed significant conformational changes of the relevant part of the protein.
A recently published comparison between NMR and X-ray structures was focused on the distances between pairs of equivalent residues and on the detection of backbone-backbone hydrogen bonds [45]. It was found that the distributions of the distance between residues are bimodal in both NMR and crystal structures. A maximum corresponds to residues contacting each other and the other to residues that are not directly in contact with each other but are separated by another residue intercalated between them. The distributions are slightly different for NMR and crystal structures. Moreover, it was observed that the number of backbone-backbone hydrogen bonds is in general higher in crystal structures and that many hydrogen bonds observed in one type of structure are not observed in the other type of structure. These observations cannot be done on the dataset of structure pairs examined in the present paper, which is larger than that used by Galziskaya and colleagues (109 against 60 pairs), since it includes also pairs of proteins that have not exactly the same amino acid sequence.
Moreover it is of fundamental importance to observe that most of the comparisons between crystal and NMR structures reported so far are strongly focused on the physico-chemical origin of the differences that are observed while little attention was devoted to the comparisons of the final results as they are delivered to the scientific community though the Protein Data Bank. It is, however, important to quantify the degree of similarity/difference between the results obtained with these two methods in order to ascertain to which extent they can be merged in structural bioinformatics and computational structural biology.
Here in we present a systematic comparison of X-ray and NMR structures performed on a non-redundant set of 109 proteins, the structure of which was determined by both crystallography and NMR spectroscopy and deposited in the Protein Data Bank [1, 2] by their authors.
METHODOLOGY
Data Set Selection
In order to compare NMR and X-ray protein structures it was necessary to extract appropriate datasets from the PDB database [1, 2]. The following multi-step procedure resulted into 109 protein structures (Table 1) that were determined by both NMR and X-ray methods.
A Non-Redundant Data Set of 109 NMR – X-Ray Structure Pairs of Nearly Identical Proteins Derived from the Protein Data Bank
| No. | NMR | X-ray | ||||
|---|---|---|---|---|---|---|
| PDB entry | Chain | Number of models | PDB entry | Chain | Resolution (Å) | |
| 1 | 2JQX | A | 1 | 1D8C | A | 2.00 |
| 2 | 1EZO | A | 10 | 1ANF | A | 1.67 |
| 3 | 1AH2 | A | 18 | 1IAV | A | 1.80 |
| 4 | 1TR4 | A | 20 | 1UOH | A | 2.00 |
| 5 | 1BXL | A | 1 | 1MAZ | A | 2.20 |
| 6 | 2GPQ | A | 10 | 1IPB | A | 2.00 |
| 7 | 1A23 | A | 1 | 1A2J | A | 2.00 |
| 8 | 1MM4 | A | 20 | 1THQ | A | 1.90 |
| 9 | 1GGR | A | 3 | 2F3G | B | 2.13 |
| 10 | 1CRP | A | 20 | 1GNP | A | 2.70 |
| 11 | 1OCA | A | 20 | 1W8L | A | 1.80 |
| 12 | 1NMV | A | 10 | 1PIN | A | 1.35 |
| 13 | 1AX3 | A | 16 | 1GPR | A | 1.90 |
| 14 | 1DF3 | A | 10 | 1JV4 | A | 1.75 |
| 15 | 1B6F | A | 23 | 1BV1 | A | 2.00 |
| 16 | 1EQ0 | A | 20 | 1DY3 | A | 2.00 |
| 17 | 1BVH | A | 15 | 1DG9 | A | 1.90 |
| 18 | 1RCH | A | 8 | 1RDD | A | 2.80 |
| 19 | 6I1B | A | 1 | 1I1B | A | 2.00 |
| 20 | 1BA9 | A | 36 | 1MFM | A | 1.02 |
| 21 | 1XPW | A | 20 | 1TVG | A | 1.60 |
| 22 | 1FXT | A | 1 | 1FZY | B | 1.90 |
| 23 | 1JOK | A | 1 | 1SNO | A | 1.70 |
| 24 | 1CFC | A | 25 | 1A29 | A | 2.74 |
| 25 | 1ORM | A | 20 | 1QJ8 | A | 1.90 |
| 26 | 1PFL | A | 20 | 1FIK | A | 2.30 |
| 27 | 1BLR | A | 22 | 1CBQ | A | 2.20 |
| 28 | 2P3M | A | 20 | 2VBS | A | 3.00 |
| 29 | 1JJJ | A | 20 | 1B56 | A | 2.05 |
| 30 | 1JBH | A | 20 | 1CRB | A | 2.10 |
| 31 | 1TBD | A | 1 | 2FUF | A | 1.45 |
| 32 | 1AEL | A | 20 | 1ICM | A | 1.50 |
| 33 | 1A63 | A | 10 | 1A62 | A | 1.55 |
| 34 | 1IY3 | A | 1 | 1IWT | A | 1.40 |
| 35 | 1CYL | A | 20 | 1HIK | A | 2.60 |
| 36 | 1CEY | A | 46 | 1CHN | A | 1.76 |
| 37 | 2JU3 | A | 10 | 1LFO | A | 2.30 |
| 38 | 1FR0 | A | 30 | 1A0B | A | 2.06 |
| 39 | 1GIO | A | 10 | 1AGI | A | 1.50 |
| 40 | 2PRF | A | 19 | 1PRQ | A | 2.50 |
| 41 | 1MVG | A | 10 | 1TVQ | A | 2.00 |
| 42 | 2AAS | A | 32 | 1AQP | A | 2.00 |
| 43 | 1FSP | A | 20 | 1NAT | A | 2.45 |
| 44 | 1PIR | A | 1 | 1P2P | A | 2.60 |
| 45 | 1IT4 | A | 1 | 1FAZ | A | 1.40 |
| 46 | 1KLV | A | 20 | 1GNU | A | 1.75 |
| 47 | 2JN8 | A | 20 | 2ES9 | A | 2.00 |
| 48 | 1SVQ | A | 20 | 1SVY | A | 1.75 |
| 49 | 1K19 | A | 20 | 1KX8 | A | 2.80 |
| 50 | 1BC4 | A | 15 | 1KM8 | A | 1.90 |
| 51 | 1BNR | A | 20 | 1YVS | A | 2.20 |
| 52 | 1A67 | A | 16 | 1CEW | I | 2.00 |
| 53 | 2NLN | A | 20 | 1OMD | A | 1.85 |
| 54 | 1F40 | A | 10 | 1FKB | A | 1.70 |
| 55 | 1MPH | A | 50 | 1BTN | A | 2.00 |
| 56 | 1N5H | A | 15 | 1PFP | A | 2.30 |
| 57 | 1IYY | A | 24 | 1BU4 | A | 1.90 |
| 58 | 2CZN | A | 38 | 2CWR | A | 1.70 |
| 59 | 1N7T | A | 20 | 2H3L | B | 1.00 |
| 60 | 2EVN | A | 20 | 2IL4 | A | 2.05 |
| 61 | 1GO0 | A | 10 | 1H7M | A | 1.96 |
| 62 | 1M42 | A | 1 | 2C9Q | A | 1.60 |
| 63 | 1IIY | A | 1 | 3EZM | A | 1.50 |
| 64 | 1JNJ | A | 20 | 1LDS | A | 1.80 |
| 65 | 1BEG | A | 18 | 1BEO | A | 2.20 |
| 66 | 1C15 | A | 16 | 1CY5 | A | 1.30 |
| 67 | 1BMW | A | 38 | 1WHO | A | 1.90 |
| 68 | 2JMV | A | 20 | 2QSK | A | 1.00 |
| 69 | 1AFH | A | 15 | 1FK0 | A | 1.80 |
| 70 | 3HSF | A | 30 | 2HTS | A | 1.83 |
| 71 | 1PQX | A | 10 | 2FFM | A | 2.51 |
| 72 | 1L8Y | A | 30 | 2HDZ | A | 2.00 |
| 73 | 2CKU | A | 15 | 2CG6 | A | 1.55 |
| 74 | 1A2S | A | 1 | 1CTJ | A | 1.10 |
| 75 | 1ACA | A | 20 | 1HB6 | A | 2.00 |
| 76 | 1GGR | B | 3 | 1POH | A | 2.00 |
| 77 | 1ACP | A | 2 | 1T8K | A | 1.10 |
| 78 | 1D3Z | A | 10 | 1AAR | B | 2.30 |
| 79 | 1RQS | A | 20 | 1CTF | A | 1.70 |
| 80 | 2AIT | A | 9 | 1HOE | A | 2.00 |
| 81 | 1FD8 | A | 1 | 1CC7 | A | 1.20 |
| 82 | 1K3G | A | 30 | 1C75 | A | 0.97 |
| 83 | 2ORC | A | 32 | 1ORC | A | 1.54 |
| 84 | 1HFG | A | 1 | 2FHT | A | 1.70 |
| 85 | 1ZUG | A | 20 | 2CRO | A | 2.35 |
| 86 | 1BQT | A | 6 | 1GZR | B | 2.0 |
| 87 | 3MEF | A | 16 | 1MJC | A | 2.00 |
| 88 | 2BTT | A | 20 | 1RUW | A | 1.80 |
| 89 | 1QQV | A | 1 | 1YU5 | X | 1.40 |
| 90 | 1LQH | A | 1 | 2ASC | A | 1.10 |
| 91 | 1IJC | A | 20 | 1F94 | A | 0.97 |
| 92 | 1AEY | A | 15 | 1SHG | A | 1.80 |
| 93 | 1ERA | A | 1 | 3EBX | A | 1.40 |
| 94 | 1ROF | A | 10 | 1VJW | A | 1.75 |
| 95 | 1JV8 | A | 23 | 1BPI | A | 1.09 |
| 96 | 1H0T | B | 40 | 1LP1 | A | 2.30 |
| 97 | 1KUN | A | 20 | 1KNT | A | 1.60 |
| 98 | 1GB1 | A | 60 | 1PGA | A | 2.07 |
| 99 | 1BFY | A | 20 | 1FHH | A | 1.50 |
| 100 | 1MBE | A | 1 | 1GUU | A | 1.60 |
| 101 | 1FDM | 20 | 2C0W | A | 3.20 | |
| 102 | 1CCM | A | 8 | 1CBN | A | 0.83 |
| 103 | 1PJF | A | 27 | 1QL1 | A | 3.10 |
| 104 | 1HEV | A | 6 | 1Q9B | A | 1.50 |
| 105 | 1ERC | A | 20 | 2ERL | A | 1.00 |
| 106 | 1KX6 | A | 20 | 1GCN | A | 3.00 |
| 107 | 1CIR | B | 20 | 1CIQ | B | 2.20 |
| 108 | 1V6R | A | 20 | 1EDN | A | 2.18 |
| 109 | 1XGA | A | 35 | 1NOT | A | 1.20 |
First, two separate FASTA [46] files, one containing the amino acid sequences of all the NMR structures and the other containing the amino acid sequences of all the X-ray structures, were prepared. Second, each sequence of the NMR FASTA file was aligned with each sequence of the X-ray FASTA file by using the Needleman-Wunsch [47] alignment algorithm and pairs with length difference larger than 3 residues and with percentage of sequence identity lower than 98% were discarded. Third, it was necessary to analyze the 'environment' of each chain, i.e. to find out if it is free or complexed and in this case what are the ligands. We checked that i) the number of other protein chains in the two types of corresponding structures (NMR and X-ray) was the same, ii) the degree of identity of the additional chains was at least 90%, and iii) that number of non-protein atoms (small molecules, nucleic acids, etc.; obviously excluding water molecules) in the two types of structures (NMR and X-ray) was similar (a difference up to three atoms was tolerated). Fourth, the sequence redundancy was reduced to 40% sequence identity with CD-HIT [48], by removing redundant sequences from the set of crystallographic structures and by identifying the counterpart within the dataset of NMR structures.
The structure validation was performed with the Z-scores of PROSA [49, 50]. The vast majority of the structures had acceptable Z-scores and only vary few of them (about 2%) had Z-scores larger than -3. Moreover, the Z-scores computed on the crystal structures were strictly correlated to the scores computed on the NMR structures (Pearson correlation coefficient = 0.86), indicating that random noise is modest.
Data Analysis
Three superposition methods were used – CE [51], DALI [52], and PROFIT [53] – since each of them can provide different results, especially if the molecules that are superposed are rather flexible. In fact, while PROFIT handles molecules as rigid bodies and always proposes only one unique superposition where the root-mean-square distance (RMSD) between equivalent Cα atoms is minimized, CE and DALI may propose more than a unique superposition, between different sub-moieties of the two molecules that are compared, each of which minimizes the RMSD and maximizes the number of equivalent Cα atoms. When CE or DALI proposed more than one optimal superposition, only the first one was considered.
The secondary structure assignments are usually stored in PDB files; however, for the purpose of consistency of the procedure, the computer program STRIDE [54] was used for all protein structures considered in the present study. Only three types of backbone conformations were used: helix (containing α helices, 310 helices and π-helices), sheet (containing strands) and loop (containing any other type) and the assignment was accomplished on the conformers in crystals. Although DSSP [55] is the most commonly used method, STRIDE was observed to correct for the tendency of DSSP to identify shorter secondary structure elements than would be assigned by an expert structural biologist, usually due to the minor local variations in structure that are most common near the termini of secondary structure elements [54].
Crystal packing contacts were determined with the locally written program CPC [9] that was also used, for example, in a previous study of thermal motion in protein crystal structures [56]. Two residues belonging to symmetry related molecules were considered to be in contact if two of their atoms were closer than 4.5 Å. Solvent accessibilities were computed with NACCESS [57] by using a solvent probe radius of 1.4 Å.
A problem often encountered in comparing PDB crystal structures and NMR structures is that the latter ones are usually deposited into the PDB as ensembles of variable numbers of single conformers. Although quite often the NMR entry contains twenty models, this number can be either smaller or larger. Consequently, if a crystal structure, which is in general a single conformer, is compared with an ensemble of conformers determined by NMR, it is necessary to compute the average difference between the single crystallographic conformer and various NMR models. In this way statistical biases in computing average values and trends within samples of varying dimensions are avoided.
RESULTS
Global Comparisons
The global level of similarity between crystal and NMR structures of identical proteins was evaluated by the root-mean-square distance (RMSD) between equivalent Cα atoms of the superposed structures (Cα atoms only), as well as by the RMSD normalized to 100 residue proteins (RMSD100) [58], defined as:
RMSD100 is the value that would be observed for a pair of structures of 100 residues exhibiting the same level of similarity as the structures actually compared (N is the number of amino acids residues). In other words this value can be considered as a normalized, size independent RMSD.
For the purpose of robustness three different computer programs were used to superpose pairs of structures (CE [51], DALI [52], and PROFIT [53]). In this way possible biases associated with a particular superposition technique were minimized. If the NMR structure was deposited into the Protein Data Bank [1, 2] as an ensemble of models, each model was superposed to the corresponding X-ray structure and the average figure of merit was calculated. This procedure was necessary since the number of models in the NMR ensembles is not the same for each PDB entry and this disuniform sampling weakens any strategy of identification of the best representative single conformation for the NMR ensembles of models.
The distributions of the RMSD and RMSD100 values are shown in Fig. (1) while the mean values are given in Table 2. Not surprisingly, the RMSD and RMSD100 values computed with PROFIT tend to be slightly larger, since this program handles molecules as rigid bodies. CE and DALI optimize the equivalencies between the subset of residues to be superposed and as a consequence, ignore some molecular moieties that are very different in the two structures that are compared (typically at the N- and C-terminus). The average values are relatively large and quite a few cases were observed for which the RMSD values are extremely large, typically for the subset of three structures (1NMV-1PIN, 1A63-1A62, 2CKU-2CG6) that contain two or more domains (defined according to the domain dictionaries used in the databases CATH [59] and SCOP [60]). Also the RMSD and RMSD100 values determined for the equivalent NMR models are similar to the values of Table 2. For the models deposited in the PDB and superposed with PROFIT the mean RMSD and RMSD100 obtained when each NMR model is compared with all others in the ensemble are 2.67 Å (± 0.11Å) and 3.98 Å (±0.12 Å), respectively. Apparently the structural variations of the proteins in solution are similar than the average divergence of the crystal structure from those in solution, though this could also be the result of lack of NMR experimental data.
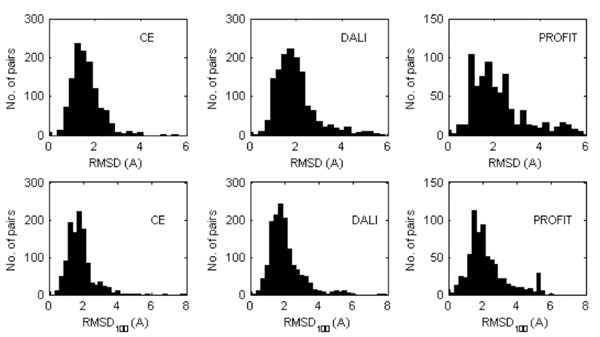
Distribution of the RMDS (top) and RMDS100 values (bottom) calculated between the equivalent X-ray and NMR protein models superposed (Cα atoms only) by either CE or DALI or PROFIT. In the case where the PDB entry corresponding to a NMR structure contains several models, all of them were considered separately.
Mean RMDS and RMDS100 Values (Standard Deviations in Parenthesis) Calculated for the Superposed Equivalent X-Ray Protein Structure and NMR Models. When the PDB entry corresponding to a NMR structure contains several models, values were averaged. The values reported in the table are thus averages of averages.
| CE mean(std)(Å) | DALI mean(std)(Å) | PROFIT mean(std)(Å) | |
|---|---|---|---|
| RMSD | 1.61(0.02) | 1.96(0.02) | 2.60(0.09) |
| RMSD100 | 2.40(0.11) | 2.01(0.02) | 3.75(0.19) |
In order to verify if some amino acids show greater discrepancies than others, the average values of the equivalent Cα atoms distances were computed for the twenty amino acids types (Table 3). Depending on the program used for 3D structure alignment the distances vary from 1.18 Å (Val) to 1.85 Å (Gly) (program CE); from 1.54 Å (Val) to 2.03 Å (Gly) (program DALI); and from 1.27 Å (Cys) to 2.78 Å (Trp) (program PROFIT).
Average Distance Values (Standard Deviations in Parentheses) Between the Equivalent Cα Atoms for Different Amino Acid Types, After Optimal Superposition of 109 Non-Redundant Pairs of Proteins. Superpositions were made with CE, DALI, and PROFIT. When the PDB entry corresponding to a NMR structure contains several models, values were averaged. The values reported in the table are thus averages of averages.
| Residue Type | CE mean(std) (Å) | DALI mean(std) (Å) | PROFIT mean(std) (Å) |
|---|---|---|---|
| Ala | 1.41(0.05) | 1.80(0.05) | 2.55(0.17) |
| Arg | 1.61(0.06) | 1.71(0.06) | 2.18(0.17) |
| Asn | 1.57(0.06) | 1.87(0.06) | 2.40(0.14) |
| Asp | 1.65(0.06) | 1.90(0.06) | 2.64(0.18) |
| Cys | 1.23(0.06) | 1.42(0.07) | 1.27(0.07) |
| Glu | 1.54(0.05) | 1.87(0.06) | 2.20(0.16) |
| Gln | 1.49(0.07) | 1.80(0.07) | 2.09(0.17) |
| Gly | 1.85(0.06) | 2.03(0.05) | 2.38(0.12) |
| His | 1.58(0.11) | 1.78(0.10) | 2.04(0.27) |
| Ile | 1.24(0.05) | 1.55(0.05) | 1.80(0.12) |
| Leu | 1.28(0.04) | 1.72(0.05) | 1.83(0.10) |
| Lys | 1.56(0.05) | 1.76(0.05) | 2.32(0.15) |
| Met | 1.55(0.10) | 1.87(0.11) | 2.14(0.25) |
| Phe | 1.23(0.06) | 1.56(0.06) | 1.79(0.16) |
| Pro | 1.70(0.09) | 2.00(0.08) | 2.50(0.20) |
| Ser | 1.66(0.06) | 1.80(0.05) | 2.37(0.14) |
| Thr | 1.48(0.06) | 1.74(0.06) | 1.96(0.11) |
| Trp | 1.26(0.11) | 1.76(0.11) | 2.78(0.42) |
| Tyr | 1.39(0.07) | 1.76(0.08) | 2.22(0.15) |
| Val | 1.18(0.04) | 1.54(0.05) | 1.77(0.11) |
| Overall | 1.48(0.07) | 1.76(0.07) | 2.16(0.17) |
Interestingly, these results are independent of the crystallographic resolution (data not shown).
Secondary Structures
In order to determine the extent of structure deformation for different types of secondary structure elements, the distances between equivalent Cα atoms, computed after their optimal superposition, were classified according to the backbone conformation. Average values are shown in Table 4. Three types of backbone conformation were considered: helix, sheet, and loops. Secondary structures were assigned according to the crystal structures using the program STRIDE [54].
Mean Distances (Standard Deviations in Parentheses) Between Equivalent Atoms in Different Secondary Structures in NMR and X-Ray Models After Cα Based Superposition. After superposition Cα-Cα distances for different types of secondary structure elements were calculated. Superpositions were made with CE, DALI, and PROFIT. When the PDB entry corresponding to a NMR structure contains several models, values were averaged. The values reported in the table are thus averages of averages.
| Secondary Structure | CE (Å) | DALI (Å) | PROFIT (Å) |
|---|---|---|---|
| Helix mean(std) distance | 1.50(0.02) | 1.80(0.02) | 2.55(0.08) |
| Sheet mean(std) distance | 1.08(0.02) | 1.40(0.02) | 1.39(0.03) |
| Loop mean(std) distance | 1.79(0.03) | 2.04(0.02) | 2.58(0.07) |
As observed above, the average distances between equivalent Cα atoms tend to be slightly larger if the structures are superposed as rigid bodies [53]. However, independently of the superposition method it can be seen that conformation of β-strands is better preserved than those of helices and loops, and this might reflect the fact that β-strands are often more buried within the protein core.
Particular attention was devoted to the loop segments, which are supposed to be rather flexible and thus to differ in crystal and NMR structures. Two types of comparisons between equivalent loops were performed. On the one hand, the n Cα atoms of the equivalent loop pairs were superposed and root-mean-square-deviation (RMSD_1) was computed. On the other, the non-loop Cα atoms were superposed and the root-mean-square-deviation (RMSD_2) was calculated by comparing the positions of the n Cα atoms of the equivalent loops. The average values of RMSD_1 and of RMSD_2 are 1.07Å (±0.31Å) and 5.6Å (±1.10Å). The first value describes the loop internal deformation and the second one describes both the deformation and the change of the loop position relatively to the rest of the protein. As expected, the RMSD_1 values are, on average, considerably smaller than the RMSD_2 values. The range of the later ones, 5-6 Å, considerably larger than the distance between Cα atoms of two subsequent residues in a polypeptide (3.8 Å) reveals large amplitude of loops movement which might be relevant for the protein function.
Furthermore, the loops were classified according to their size (nres, number of residues) and involvement in crystal packing (ncpc, number of residues involved in crystal packing contacts; 0 ≤ ncpc ≤ nres). Table 5 shows the average RMSD_1 values computed after optimal superposition of the nres Cα atoms of the loop pairs with different values of ncpc. It appears that there is no correlation between the involvement of the loop in crystal packing contacts and the difference between the loop conformations observed in the crystals and in solution. Analogous results were observed by monitoring the RMSD_2 values.
Mean RMSD of Loops of Different Length and Differently Involved in Crystal Packing Contacts in the Solid State. Standard deviations of the mean are shown in parentheses. The length of the loop is measured by the number of residues (nres). Superpositions were made with PROFIT. The measure for the crystal packing contacts is number of residues that are involved in crystal packing interactions (ncpc). Therefore ncpc ≤ nres. When the PDB entry corresponding to a NMR structure contains several models, all of them are considered separately.
| nres | ncpc | Number of Examples | RMSD_100 (std) (Å) | nres | ncpc | Number of Examples | RMSD_100 (std) (Å) |
|---|---|---|---|---|---|---|---|
| 3 | 0 | 46 | 1.18(0.07) | 6 | 3 | 10 | 0.62(0.04) |
| 3 | 1 | 106 | 0.91(0.02) | 6 | 4 | 54 | 1.11(0.08) |
| 3 | 2 | 155 | 0.94(0.02) | 6 | 5 | 4 | 1.33(0.09) |
| 3 | 3 | 149 | 0.99(0.04) | 6 | 6 | 50 | 1.09(0.03) |
| 4 | 0 | 26 | 0.60(0.05) | 7 | 0 | 10 | 1.13(0.00) |
| 4 | 1 | 24 | 0.73(0.05) | 7 | 4 | 3 | 0.50(0.03) |
| 4 | 2 | 73 | 1.39(0.02) | 7 | 6 | 23 | 1.14(0.08) |
| 4 | 3 | 117 | 1.06(0.02) | 7 | 7 | 10 | 1.09(0.01) |
| 4 | 4 | 174 | 1.12(0.01) | 8 | 0 | 10 | 1.31(0.01) |
| 5 | 2 | 84 | 1.21(0.04) | 8 | 2 | 20 | 0.94(0.01) |
| 5 | 3 | 108 | 0.92(0.02) | 8 | 5 | 1 | 1.47(0) |
| 5 | 4 | 85 | 0.80(0.03) | 8 | 6 | 1 | 1.19(0) |
| 5 | 5 | 91 | 1.10(0.03) | 9 | 7 | 23 | 1.02(0.02) |
| 6 | 1 | 10 | 1.50(0.00) | 9 | 8 | 40 | 1.71(0.09) |
Side Chains
The possibility that side chains have different conformations in the crystal structures and in the NMR structures was also examined. For this purpose, six, structurally the most similar pairs of identical protein chains (with RMSD < 1 Å after rigid-body superposition of all the equivalent Cα atoms using PROFIT software) were retained for further comparison (1GGR_A-2F3G_B, 1OCA_A-1W8L_A, 1JJJ_A-1B56_A, 1IT4_A-1FAZ_A, 1F40_A-1FKB_A and 1XGA_A-1NOT_A). After superposition of the equivalent Cα atoms, individual RMSDs for each pair of equivalent side chains were computed (by considering all non-hydrogen side chain atoms).
On average, the side chain RMSD in these six pairs is equal to 1.31 Å with standard deviation of the mean equal to 0.32Å. However, the uni-modal distribution has a maximum close to 0 Å see Fig. (2a)). It was noticed that the structure discrepancy depends of the amino acid type (see Fig. (2b)): apolar side chains tend to be less variable than polar side chains independently of the side chain dimension and this might reflect the fact that more NOEs are observed for apolar moieties in NMR studies. Triptophane side chain orientations are very similar in NMR and crystal structures despite the large dimension of the residue while histidine side chain orientations tend to be more variable, perhaps because of the ability to change its protonation state. Charged residues are among the most variable.
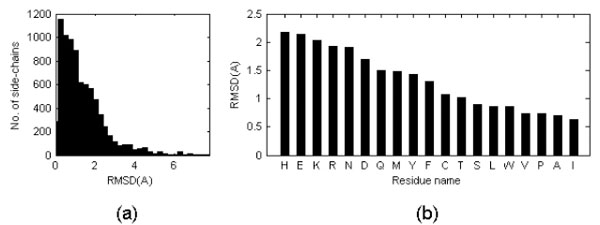
(a) Distribution of side chain RMSD after optimal superposition of all Cα atoms (only for the cases in which the RMSD of the Cα atoms is lower than 1 Å). When the PDB entry corresponding to a NMR structure contains several models, values were averaged. The values reported in the figure are thus averages of averages. (b) Mean side chain RMSD shown on per residue type basis. RMSD is calculated on a basis of all side chain atoms excluding hydrogen atoms.
The results suggest that side chains located at the protein surface (polar and charged in the case of soluble proteins) tend to be more flexible than the buried ones. It is of course trivially true that residues at the surface are more flexible although there might be the consequence of insufficient experimental evidence for them, with no NOEs of unclear electron density. Actually, solvent accessibility and side chain RMSD are related, though with a rather modest correlation coefficient (0.462; see Fig. 3). This relation is not surprising, since both the conformational and solvatation entropy terms of the side chains protruding from the protein significantly depend on the protein environment.
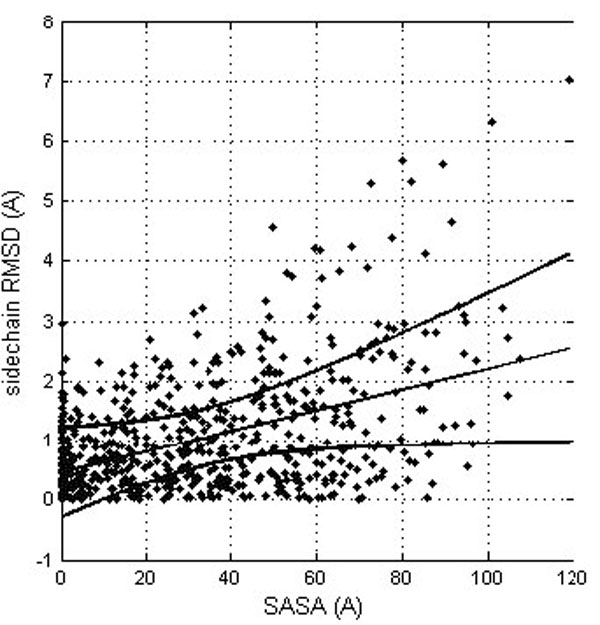
Correlation between the residue solvent accessibility and the RMDS for the corresponding side chains (after their optimal superposition). The linear trend line is shown (straight line) together with the confidence interval at the 0.99 probability level (curved lines).
However, it is important to detect if different side chain orientations can be observed for residues that have perfectly matching Cα atoms. In fact, it would not be surprising to see differently oriented side chains in protein moieties that show different backbone conformation. Fig. (4) shows the relationship of the side chain RMSD on the distance between the superposed, equivalent Cα atoms (only six, structurally the most similar pairs of identical protein chains, all Cα atom RMSD < 1Å). Each residue is represented by a point. The linear regression line is shown together with the 99% confidence interval. Obviously, most of the residues can be superposed very well, since only six structure pairs that fit better than RMSD = 1Å are analyzed. However, it clearly appears that for the few Cα atoms that cannot be well superposed (large distance between Cα atoms), also the side chains are unmatched. However, in a limited number of cases where the Cα atoms are well superposed the side chains seem to be very different. About 15% of the points are above the upper confidence interval. However, most of these cases refer to residues that are very exposed to the solvent and are thus not really surprising. Only very few cases refer to residues that are buried in the protein interior. One example is Tyr 48, the side chain orientations of which in the crystal structure (1W8L) and in the first model of the NMR structure (1OCA) of human peptidyl-prolyl cis-trans isomerase are completely different (see Fig. 5). In the first case, the side chain OH group of tyrosine makes a hydrogen bond with the main-chain oxygen atom of Gly 65 while in the second case it is hydrogen bonded to the main-chain oxygen atom of Ser 110. The side chain torsions χ1 and χ2 of Tyr 48 are -60° and -43°, respectively in the crystal structure and -123° and 64°, respectively in the NMR structure, while the φ and ψ torsions are very similar in the both structures (-70° and -25°in the crystal structure and -81° and -27° in the NMR structure). However, only in one third of the NMR models of human peptidyl-prolyl cis-trans isomerase deposited in the Protein Data Bank χ1 of Tyr 48 is close to -120°, corresponding to an unusual eclipsed conformation, while in the two thirds of the models the conformation is staggered, like in the crystal structure.
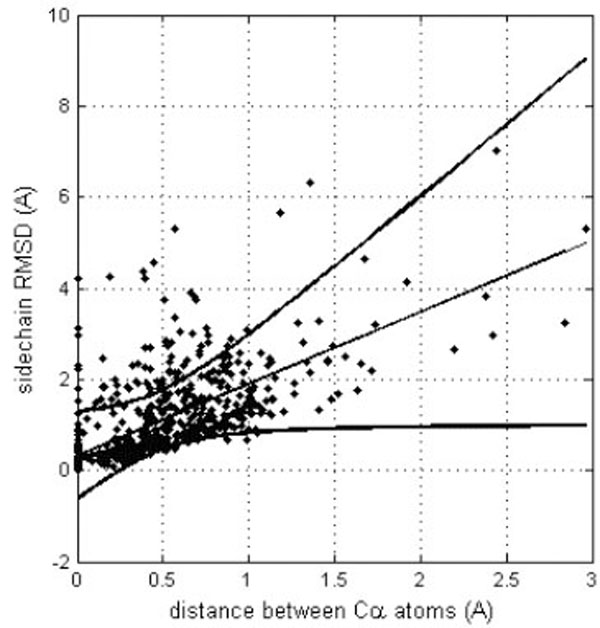
Correlation between equivalent Cα atom distances (after their optimal superposition) and RMSD for the corresponding side chains. The linear trend line is shown (straight line) together with the confidence interval at the 0.99 probability level (curved lines).
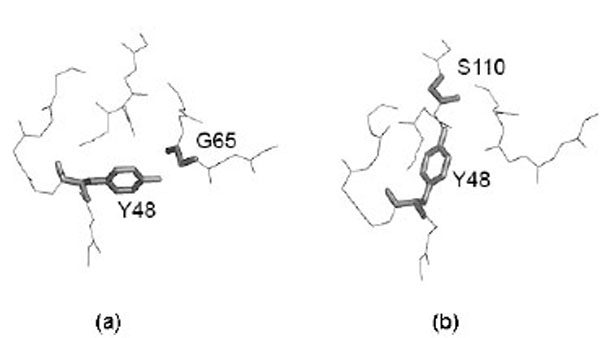
Example of differently oriented side chain in a case where two Cα atoms are well superposed. Most of these cases refer to residues that are very exposed to the solvent. Only very few cases refer to residues that are buried in the protein interior. This is the case of Tyr 48 in (a) 1W8L (X-ray structure) and (b) model 1 of 1OCA (NMR structure). Figure is prepared using PyMOL [64].
DISCUSSION
A non-redundant set of 109 pairs of crystal and NMR structures of nearly identical proteins were compared by using three different superposition methods (CE, DALI, and PROFIT). According to the domain dictionaries used in the databases CATH and SCOP, 98% of them are single domain proteins. Our analysis showed that the structures are, on average, surprisingly dissimilar. The RMSD100 computed on the Cα atoms after their optimal superposition ranges from about 2 Å to nearly 4 Å and the RMSD ranges from about 1.5 to about 2.5 Å (see Table 2). The calculated RMSD values are much larger than those observed in a large scale analysis of the similarity level between independently determined crystal structures of identical proteins [61]. For Example, the RMSD100 value calculated for the pairs of identical protein structures refined at 1.6 Å resolution is, on average, close to 0.1 Å, and for structures at resolution close to 2.8 Å it is about 0.7 Å. These values are clearly much smaller than those reported in Table 2 for the comparison of crystal and NMR structures indicating that crystallographic and spectroscopic results are considerably different and can, as a consequence, be considered as alternative source of information. This is also supported by the observation that the average RMSD value between different models of the same NMR structure, which is equal to 2.67 Å, is close to those determined from comparison of the crystal and NMR structures. This also agrees with the finding that the global level of similarity between NMR and crystal structures is the same for identical structure and those slightly different (sequence identity 98%). Divergence between crystal and NMR structures can reflect both, genuine flexibility and unestimated errors of the methods.
The correlation between conformational deviations and residue type revealed that rigid parts consist mainly of hydrophobic amino acids, such as isoleucine, leucine, and valine, while parts of the protein consisting predominantly of charged residues, (such as arginine, lysine, aspartic acid, and glutamic acid) tend to adopt different orientations in crystal and NMR structures. (Table 3) However, there is not an easy and convincing way to explain systematically and quantitatively the influence of amino acid types on the protein structure flexibility. Although the solvent accessibility is an important factor (see Fig. 3) the correlation between accessibility of residues to solvent and conformational plasticity is far from being perfect.
Further on, we focused on some other structural features, like for example the secondary structure elements. For simplicity, only three types of the secondary structure were considered (helical, strand, and loop) and they were assigned on the basis of the crystal structure since the regular and periodical backbone stereochemistry is often less well defined in the solution (NMR) structures. We observed that β-strands on average match better than helices and loops (see Table 4). Despite the correlation between solvent accessibility and conformational plasticity is relatively modest (see Fig. 3), this is probably due, at least in part, to the fact that β-strands tend to be buried in the protein interior while loops are on the contrary solvent exposed and helices are very often amphipathic, with one side exposed to the solvent and another buried in the protein core.
Loops are mostly solvent exposed moieties, and the RMSD values were very high, especially when loop atoms were not used for proteins superposition pointing to the large amplitude of loop displacements regarding the rest of the protein. Most of this flexibility is the result of loop movements in solution and their involvement in crystal packing interactions does not influence significantly the RMSD values. For example, four-residue long loops were more similar if solvent exposed and not involved in crystal packing contacts (RMSD = 0.60 Å for ncpc = 0) than if extensively involved in crystal packing contacts (RMSD = 1.12 Å for ncpc = 4). However, the opposite is observed in five-residue long loops, which were more similar if all the five residues were in contact with symmetry related molecules (RMSD = 1.10 Å) than if only two residues were involved in crystal packing contacts (RMSD = 1.21 Å). This is rather surprising, since one would expect that a solvent exposed loop without crystal packing contacts should be more similar to the equivalent loop in the NMR structure than a loop that is involved in crystal packing interactions. This is not observed, at least not systematically, in the data examined in the present work. Two possible explanations can be proposed. On the one hand it is possible to hypothesize that crystal packing does not influence significantly the conformation of the loops. Such a hypothesis is supported by the observation that protein crystals are not very stable and difficult to obtain. Nature worked against protein crystallization and favors protein solubility [62]. The free energy of crystallization is thus quite small and cannot allow protein to change drastically their shape. On the other hand, the conformational ensemble of the protein structures in solution is probably much more complicated than the limited number of models deposited into the Protein Data Bank indicates. Finally the recent findings showing that a single conformation is probably insufficient to account for the X-ray diffraction data in protein crystallography [13, 63] additionally complicate the story.
Analysis of the side chains packing in crystal and NMR structures performed for the pairs of structures in which the Cα atoms are superposed with RMSD < 1 Å, revealed that some residues with good match of their backbone (Cα atoms) have the side chains differently oriented. However, nearly always this occurred at the surface of the globular proteins where atomic positions are often ill-defined given the intrinsic flexibility of molecular moieties protruding towards the solvent. Only in very few cases it was possible to observe buried residues that had superposable backbone atoms and not superposable side chains. An example is shown in Fig. (5), where the tyrosine 48 of human peptidyl-prolyl cis-trans isomerase A has the same backbone conformation in the crystal and in the NMR structure while its side chain is oriented in a completely different way, probably because of the formation of alternative hydrogen bond networks. In the first case, the side chain OH group of tyrosine makes a hydrogen bond with the main-chain oxygen atom of Gly 65 while in the second case it is hydrogen bonded to the main-chain oxygen atom of Ser 110.
ACKNOWLEDGEMENTS
Funding from BIN-II and BIN-III (GEN-AU Austrian research program) is gratefully acknowledged. Grants from the Ministry of Science, Republic of Croatia, number 036-0362214-1987 and number 098-1191344-2860 are gratefully acknowledged.
Helpful discussions with G. Vriend are also acknowledged. This paper is dedicated to the memory of Warren DeLano, the author of PyMol; structural biology would have be different without him.