All published articles of this journal are available on ScienceDirect.

Protein Domain Boundary Predictions: A Structural Biology Perspective
Abstract
One of the important fields to apply computational tools for domain boundaries prediction is structural biology. They can be used to design protein constructs that must be expressed in a stable and functional form and must produce diffraction-quality crystals. However, prediction of protein domain boundaries on the basis of amino acid sequences is still very problematical. In present study the performance of several computational approaches are compared. It is observed that the statistical significance of most of the predictions is rather poor. Nevertheless, when the right number of domains is correctly predicted, domain boundaries are predicted within very few residues from their real location. It can be concluded that prediction methods cannot be used yet as routine tools in structural biology, though some of them are rather promising.
INTRODUCTION
Computational/mathematical approaches, such as structural bioinformatics [1], structural class prediction [2, 3], molecular docking [4-9], molecular packing [10, 11], pharmacophore modelling [12], Mote Carlo simulated annealing approach [13], diffusion-controlled reaction simulation [14], graph/diagram approach [15-21], bio-macromolecular internal collective motion simulation [22], QSAR [23-25], protein subcellular location prediction [26-30], protein structural class prediction [31, 32], identification of membrane proteins and their types [33], identification of enzymes and their functional classes [34], identification of proteases and their types [35], protein cleavage site prediction [36-38], and signal peptide prediction [39, 40] can timely provide very useful information and insights for both basic research and drug design and hence are widely welcome by science community.
Several computational approaches aimed to the prediction of protein domain boundaries have been published during the last few years [41, 42]. Besides their intrinsic interest in genome analysis and evolution studies, they are tools that structural biologists may use to optimize the design of the constructs of the proteins, the three-dimensional (3D) structure of which must be determined [43]. While this is particularly important in structural genomics (SG), where the targets have, in general, not been deeply characterized with appropriate biochemical and biophysical tools, this can be important also for traditional hypothesis-driven structural biology projects, where a fine tuning of the construct that is inserted into the experimental pipeline – cloning, expression, purification, etc. – is often necessary in order to get suitable samples [44].
Several information about structure prediction methods are periodically published in the framework of the CASP initiative, the main goal of which is to promote an evaluation of computational prediction methods [45]. This is a periodical exercise, performed every two years since 1994. During CASP experiment a series of protein sequences, the 3D structure of which was determined experimentally though it was not yet published, are distributed to research groups that develop computational methods for predicting protein structural features. It is thus a blinded test, where several methods of “in silico” structural biology techniques can be compared to the reality and to each other. Nevertheless, in each CASP run, the number of targets is obviously quite limited and a prediction method that performs very well in CASP is not necessarily better than other techniques in the reality. It is necessary to make additional investigations focusing on the possibility to use these prediction methods for practical application in structural biology.
Although it is impossible to consider it a rule, it is generally easier to work with single-domain proteins than with multi-domain proteins, since the latter ones tend to be conformationally more flexible [46]. For example, the reciprocal orientation of the domains can vary and depend on the presence of other molecules. Multi-domain proteins may also be little prone to refold if, by chance, they had been over-expressed in cells lacking proper chaperones. This does not mean that multi-domain proteins cannot be studied but it implies that some care must be paid in structural biology experiments and that longer time and larger funding can be expected to be necessary to solve multi-domain proteins. It is thus extremely important to be able to predict, on the basis of its amino acid sequence, if a protein contains one or more structural domains.
CASP is divided into several sections, ranging from prediction of conformational disorder to tertiary structure prediction. Protein domain boundary predictions began to be included in the CASP initiative in 2004. The dissection of a protein into separate structural domains is in fact not trivial at all [46, 47]. It is related to the ill-definition of what a protein domain is. An amino acid segment can be in fact considered to be a structural domain if i) it is a compact ensemble of atoms/residues; ii) it is an ensemble of atoms/residues that behaves as a rigid body, in the sense that it can move relative to other protein moieties without changing its shape; iii) it is a self-folding subunit; iv) it is a polypeptide segment well conserved during molecular evolution. Given the ambiguity in any quantitative definition, the real domain boundaries were defined according to the CASP7 organizers and assessors [47]. They found a reasonable consensus definition for each investigated protein, which seems to be well suitable for a structural biology analysis.
The present study is attempted to compare modern approaches for predicting protein domain boundaries and to define new prediction strategies. Here, we refer to the exercise named CASP7, organized in 2006, for which both predictions and experimental data are available on-line (http://www.predictioncenter.org/casp7/Casp7.html). In this manuscript, several tools, designed for predicting domain boundaries on the basis of the amino acid sequence, will be compared to the real domain architecture. The analysis of these data allows one to answer the following basic questions: i) Is it possible to predict, with the presently available bioinformatics tools, if a protein is made by a single domain or if it contains more than one domain? ii) What is the statistical significance of the available predictions? iii) How accurately can the domain boundaries be predicted in the cases where the presently available bioinformatics predictions work well?
METHODS
Available Data and Tools
Data were obtained from the CASP7 web page (http://predictioncenter.gc.ucdavis.edu/casp7/). Table 1 shows the bioinformatics tools that are freely available and that were used in CASP7. Protein domain prediction methods can be classified into three main categories [42]: i) homology prediction; ii) domain recognition; iii) new domain prediction methods. The 14 prediction methods regarded in present study include all types of approaches. The homology prediction is presented by the chop [48, 49] methods that assign the query sequence to known PDB chains. Dsp [42] uses in addition more general properties of sequence conservation throughout the protein and it can be considered as lying between domain homology and new domain predictions. Domssea [42] belongs to the domain recognition approaches. It is based on the assumption that secondary structure is a more conserved feature of proteins with similar folds than sequence. Domssea aligns the secondary structure predicted for a query protein against a database of 3D domain structures and derives the domain boundaries from the known domain with the most similar secondary structure. Robetta [50] applies BLAST/PSI-BLAST for domain homology prediction and it uses FFAS03 and 3D-Jury to find remote homologues of known domain structure. Hhpred [51] is a server for remote homology detection and for structure prediction using pairwise comparison of profile hidden Markov models (HMMs). In the foldpro [52] method the structural relevance of the query-template pairs is extracted from global profile-profile alignments in combination with predicted secondary structure, relative solvent accessibility, contact map and beta-strand pairing using support vector machines. Distill [53] provides prediction of Contact Density defined as the Principal Eigenvector (PE) of a residue contact map. This information is an important intermediate step towards ab initio prediction of protein structure and is used to identify domains. Baker generates 3D protein models using the de novo prediction algorithm Rosetta and then assigns domain boundaries using Taylor's structure-based domain identification technique. Maopus performs a template screening with PSI-BLAST and FFAS03. The SKELEFOLD approach implemented in Maopus is a de novo folding algorithm that uses vector representations of secondary structural elements; domain boundaries are defined with three sequence-based filters. In the domfold method, the output from DomSSEA, DISOPRED and HHsearch is parsed to form a consensus. Metadp [54] and NNput are meta servers that comprise a number of domain prediction methods.
Bioinformatics Tools Examined in CASP7 (Names were Taken from CASP)
| Tools | URL | Reference |
|---|---|---|
| baker | http://robetta.org/submit.jsp | [50] |
| chop | http://cubic.bioc.columbia.edu/services/chop/index.htm | [48,49] |
| chophomo | http://cubic.bioc.columbia.edu/services/chop/index.htm | [48,49] |
| distill | http://distill.ucd.ie/distill/ | [53] |
| domfold | http://www.reading.ac.uk/bioinf/DomFold | * |
| domssea | http://bioinf.cs.ucl.ac.uk/dompred/ | [42] |
| dps | http://bioinf.cs.ucl.ac.uk/dompred/ | [42] |
| foldpro | http://www.igb.uci.edu/servers/psss.html | [52] |
| hhpred1 | http://toolkit.tuebingen.mpg.de/hhpred | [51] |
| hhpred3 | http://toolkit.tuebingen.mpg.de/hhpred | [51] |
| maopus | http://sigler.bioch.bcm.tmc.edu/CASP7-DOM/ | * |
| metadp | http://meta-dp.cse.buffalo.edu | [54] |
| NNput | http://webmobis.cs.put.poznan.pl/webmobis/app | * |
| Robetta | http://robetta.org/submit.jsp | [50] |
* - No information provided by authors.
Some of the bioinformatics methods provide multiple predictions. In this case, only the first, which is considered to be the more reliable, was retained for further analysis. Predicted domain boundaries were obtained from the CASP7 web page. The experimental domain boundaries were also obtained from the CASP7 web page, where they were generated by a group of expert scientists. 95 proteins are considered. Given that predictions were not deposited for each protein and for each prediction method, this results in a set of 1210 predictions [47].
Multi-Domain Prediction Using Protein Length
To predict, on the basis of the protein length, that a protein contains one domain or it is a multi-domain construct, a threshold value can be used. If the protein is longer than the threshold value it consists of more than one domain. On the contrary, a protein, smaller than this threshold value, would be predicted to contain only a single domain. Consequently, a true positive (tp) is defined as a multi-domain protein, which is correctly predicted to be a multi-domain protein; a multi-domain protein that is predicted to contain a single domain is defined a false negative (fn); a single-domain protein predicted to be a multi-domain protein is defined a false positive (fp); and a correctly predicted single-domain protein is defined a true negative (tn).
These four types of predictions can be used to estimate the reliability of this prediction methodology. A number of figures of merit have been used for that, like, for example, the Matthews correlation coefficient (mcc) [55]
the values of which range from -1 to +1 (larger values indicate better predictions) and is little affected by sample heterogeneity (the number of single-domain proteins can be different from the number of multi-domain proteins).
The prediction accuracy was validated with a Jack-knife procedure. In statistical prediction, the following three cross-validation methods are often used to examine a predictor for its effectiveness in practical applications: independent test dataset, sub-sampling test, and Jack-knife test [56]. However, as elucidated in references [26] and [27], amongst the three cross-validation methods, the Jack-knife test is deemed the most objective that can always yield a unique result for a given benchmark dataset, and hence has been increasingly used and widely recognized by investigators to examine the accuracy of various predictors [57-66].
Statistical Significance of Predictions
To compare the accuracy of different methods with a random prediction we estimated numerically the probability density functions of the indices used to measure the classification validity. This approach is based on idea that the problem of domain boundary prediction using the amino acid sequence is a classification problem. Each residue is in fact predicted to belong to a certain class and it cannot belong to two different clusters at the same time. In other words, a residue can be predicted to belong to a certain domain, to another domain, or to a linker segment. The comparison between a prediction and the reality or between two predictions can thus be performed by using statistical tools that are routinely employed to compare alternative classifications [67] and that are briefly described below.
Given for example two classifications (C and K) of n residues, it is possible to count the number of cases in which residues i and j were classified in the same group in C and K (n_ss), the number of cases in which i and j were classified in the same group in C and in different groups in K (n_sd), the number of cases in which i and j were classified into two different groups in C and in the same group in K (n_ds), and the number of cases in which i and j were classified into two different groups both in C and in K (n_dd). On the basis of this description, it is possible to compute the Jaccard index (J), the Rand coefficient (R), and the Fowlkes-Mallows index (FM), which are defined as:
where
By definition, if the two classifications C and K are identical, all the indices (J, R, and FM) are equal to one. It is also important to observe that these indices can be computed independently of the fact that the classifications C and K contain the same number of clusters. This means that the values of J, R, and FM can be computed also if in one case, for example the classification C, all the residues were predicted to be in a unique domain while in the other case, for example the classification K, some residues were assigned to different domains. The only constraint to the computation of J, R, and FM is that both classifications C and K must include the same number of residues, and in the present case this is obvious.
The computation of the values of J, R, and FM is elementary. The estimation of their statistical significance is less obvious [67]. For example, it is difficult to estimate the probability that a certain value of the index J was obtained by chance. From another point of view, if JCK > JDL, where JCK monitors the similarity between the classifications C and K and JDL difference between the classifications D and L, it is clear that C and K are more similar to each other than D and L. However, it is more difficult to estimate the statistical significance of the inequality JCK > JDL. In other words, it is more difficult to estimate the probability that C and K are really more similar to each other than D and L. This depends on the fact that the probability density functions of the indices J, R, and FM are unknown and must therefore be estimated numerically on the basis of adequate simulations.
Therefore, we generated a series of simulated partitions, using a Metropolis-Monte Carlo approach, by mean of the following procedure. Each partition is characterized by a series of boundaries that separate a domain and a loop and that can be located also at the N- or at the C-terminus. Given a protein containing N residues, a boundary can be any integer k with 1 ≤ k ≤ N. A series of boundaries were generated iteratively. The first (k0) was randomly selected in the range (1, N); the second (k1) was randomly selected in the range (1, m0), where m0 = N - k0; the third (k2) was randomly selected in the range (1, m1) where m1 = m0 - k1; and so on, the ith boundary (ki) was randomly selected in the range (1,mi-1), where m i-1 = mi-2-k i-1. Two constrains were imposed during the generation of random domain boundaries within a protein. We considered that a domain must contain more than 30 residues and a loop size must be smaller than 30 residues.
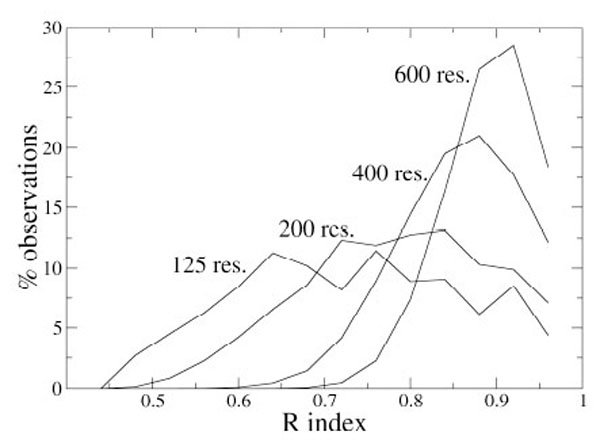
10,000 random partitions into domains were generated for proteins containing 75, 100, 125, ..., 550, 575, 600 residues. It was then possible to make 49,995,000 pairwise comparisons between two partitions and the 49,995,000 values of the coefficients J, R, and FM were retained in order to determine their distributions.
As an example, Fig. (1) shows the distributions of the index R for some N values. It appears that the distribution dispersion decreases if N increases and that the maximum moves to higher R values for larger proteins. With these data, it is possible to estimate the probability pR to have R values higher than a given value Rx, simply by integrating the probability density curve from Rx to 1, and, analogously, it is possible to get the statistical significance for the other indices.

Distribution of the R index values (fixed bin width of 0.04) computed on 10,000 simulated partitions of proteins containing different number of residues.
Boundary Accuracy
The definition of what is a well predicted domain is obviously arbitrary and here the following conditions were used in order to select the predictions that can be considered to be satisfactory. If the domain contains N residues and it is predicted to contain M residues, and if C is the number of residues that are found in both the real and the predicted domain, a good prediction was defined as a case in which
and
For well predicted domains, we then computed the differences between the sequence position in which the domain is predicted to begin and the sequence position in which it begins in the reality (Delta_b). Note that a negative value of Delta_b indicates that the domain is predicted to begin before the real beginning along the protein sequence. Analogously, we also computed the differences between the sequence position in which the domain is predicted to end and the sequence position in which it ends in the reality (Delta_e). A positive value of Delta_e indicates that the domain is predicted to be slightly longer, at its C-terminus, than the reality.
RESULTS AND DISCUSSION
Single-Domain Versus Multi-Domain Proteins
Fig. (2) shows the distributions of the protein dimensions, measured by the number of amino acid residues, for the single- and multi-domain proteins examined in the CASP7 experiment. As expected, single-domain proteins tend to be smaller than multi-domain proteins, though some overlap between the two distributions exists.
Distribution of the number of residues (nres) in the single and muti-domain proteins examined in the CASP7 experiment.
It is thus easy to select a threshold value t and to predict that a protein contains only one domain if smaller than t and that it is multi-domain protein if larger than t. Table 2 shows the mcc values [see equation 1] observed at various threshold values and validated with a Jack-knife procedure for the proteins examined in the CASP7 experiment. It can be observed that the mcc values are obviously smaller for very small or large values of the threshold. On the contrary they are rather large (>0.6) for intermediate threshold values and the highest mcc (0.628) is observed with a threshold of 200 residues. This prediction approach is clearly very naive. It simply assumes that a protein domain has a little probability to be very large and, as a consequence, that larger proteins have a higher probability to contain two or more domains.
Matthews Correlation (mcc) at Various Threshold Values (t)
| t | mcc |
|---|---|
| 70 | 0.063 |
| 80 | 0.111 |
| 90 | 0.173 |
| 100 | 0.233 |
| 110 | 0.276 |
| 120 | 0.307 |
| 130 | 0.367 |
| 140 | 0.397 |
| 150 | 0.469 |
| 160 | 0.535 |
| 170 | 0.582 |
| 180 | 0.586 |
| 190 | 0.614 |
| 200 | 0.628 |
| 210 | 0.544 |
| 220 | 0.559 |
| 230 | 0.510 |
| 240 | 0.445 |
| 250 | 0.462 |
| 260 | 0.346 |
| 270 | 0.330 |
A protein is predicted to contain a single domain if it contains less residues that t and it is predicted to contain more than one domain if it has a number of residues larger than t. Data are taken from the proteins examined in the CASP7 experiment.
It is interesting to compare the results of this extremely simple prediction strategy with the results obtained within the CASP7 experiment, where several prediction methods were applied to about 100 proteins. Table 3 shows the mcc values computed on the basis of the predictions deposited by the participants to the CASP7 experiment. The same classification in tp, fp, fn, and tn, which is described in the Methods section, was used. This means that if protein P contains more than a single domain and it was predicted to contain more than a single domain by using the prediction method M, this was considered a true positive (tp). On the contrary, if it was predicted to contain only one domain by the method M, the prediction was considered a false negative (fn), etc. The data of Table 3 clearly show that most of the prediction methods are less reliable than the predictions based on the very simple assumption that a small protein has a high probability to contain a single domain and that a large protein is likely to contain two or more domains. Actually, only four methods (baker, foldpro, maopus and robetta) can predict a multi-domain protein better than the simple predictor (Matthews correlation coefficient larger than 0.628).
Matthews's Correlation Coefficients (mcc) Associated with the Prediction of Multi-Domain Proteins by Various Methods Used in the CASP7 Experiment
| Method | mcc |
|---|---|
| baker | 0.722 |
| chop | 0.178 |
| chophomo | 0.230 |
| distill | 0.260 |
| domfold | 0.262 |
| domssea | 0.410 |
| dps | 0.277 |
| foldpro | 0.840 |
| hhpred1 | 0.304 |
| hhpred3 | 0.272 |
| maopus | 0.696 |
| metadp | 0.189 |
| NNput | 0.097 |
| robetta | 0.734 |
What does this mean? Are these bioinformatics tools useless in structural biology? The answer is no. First, some of them seem to be rather accurate. Second, these computational techniques were not specifically trained to identify multi-domain proteins and it is thus not surprising that some of them are not suitable to discriminate mono- and multi-domain proteins. However, it is reasonable to suppose that these bioinformatics tools are still immature and progress should be expected in the future.
Is the Partition Correct?
Table 4 shows the average values of the J, R, and FM indices computed by comparing predicted and real partitions [see equations (2)-(4)]. All the values tend to be large, quite close to their maximal value of 1. However, the probabilities (pJ, pR, and pFM) to observe by chance values higher than these are quite large, ranging from about 30% to about 70%. Baker, foldpro, maopus and robetta are better in predicting a partition that is closer to the real one, with J, R, and FM values that are larger and have a minor probability to be observed by chance. Not surprisingly, they are the same methods that work better to identify multi-domain proteins (see the mcc values of Table 3).
Average Values of the Indices J,R, and FM and of the Probability pJ, pR, and pFM that a Values Higher than the One that is Observed Might be Obtained by Chance. Standard Deviations of the Mean are Reported in Parentheses Method
| Method | J | R | FM | pJ | pR | pFM |
|---|---|---|---|---|---|---|
| baker | 0.80(0.02) | 0.82(0.02) | 0.88(0.01) | 39(4) | 35(4) | 37(4) |
| chop | 0.66(0.03) | 0.70(0.03) | 0.79(0.02) | 66(5) | 63(5) | 63(5) |
| chophomo | 0.66(0.03) | 0.69(0.03) | 0.79(0.02) | 67(5) | 65(5) | 64(5) |
| distill | 0.70(0.02) | 0.73(0.02) | 0.82(0.01) | 58(4) | 56(4) | 55(4) |
| domfold | 0.76(0.02) | 0.77(0.02) | 0.86(0.01) | 49(5) | 48(5) | 46(5) |
| domssea | 0.76(0.03) | 0.78(0.02) | 0.86(0.02) | 50(5) | 48(5) | 48(5) |
| dps | 0.74(0.03) | 0.77(0.02) | 0.84(0.02) | 55(5) | 52(5) | 52(5) |
| foldpro | 0.82(0.02) | 0.84(0.02) | 0.90(0.01) | 34(4) | 32(4) | 31(4) |
| hhpred1 | 0.77(0.02) | 0.78(0.02) | 0.86(0.01) | 46(4) | 45(4) | 42(4) |
| hhpred3 | 0.76(0.02) | 0.78(0.02) | 0.86(0.01) | 46(4) | 45(4) | 43(4) |
| maopus | 0.80(0.02) | 0.83(0.02) | 0.88(0.01) | 42(5) | 36(5) | 39(5) |
| metadp | 0.76(0.03) | 0.77(0.03) | 0.86(0.02) | 49(5) | 48(5) | 46(5) |
| NNput | 0.71(0.02) | 0.73(0.02) | 0.83(0.01) | 56(4) | 55(4) | 53(4) |
| robetta | 0.79(0.02) | 0.81(0.02) | 0.87(0.01) | 40(4) | 36(4) | 37(4) |
It must also be observed that matching between prediction and reality is slightly better for small proteins than for large proteins. For example, the probability pJ to find J values larger than those observed by comparing the reality and the predictions of the method "baker" is on average equal to 39%, it decreases to 33% for proteins shorter than 150 residues, and it increases to 43% for proteins containing more then 150 amino acids. This is actually not surprising, since it is easier to predict that a small protein contains a single domain, with, perhaps, two small N- and C-terminal segments protruding from the domain. However, it must be noted that, despite the fact that the pJ, pR, and pFM values can be used only as semi-quantitative indicators - since they are obtained from empirical statistical distributions - it is quite clear that the domain boundary predictions are still quite far from matching the reality.
Are the Domain Boundaries Correct?
We have seen in the previous chapters that the bioinformatics tools are not yet mature enough to be used as routine instruments to design structural biology experiments. However, a very positive feature of these computational methods is that when they work [see equations (6) and (7)] they work very well.
Table 5 shows the percentage of domains that are correctly predicted [according to equations (6) and (7)] and the discrepancy between the real and the predicted boundary in the subset of domains that are correctly predicted. It appears that only a relatively modest fraction of the domains can be considered to be well predicted, according to the criteria defined by equations (6) and (7). The percentage of good predictions is about 30-40%, with some prediction methods behaving considerably better than the others and able to well predict about 60% of the domains. The average values of Delta_b (see Methods) are close to and lower than 0 for all the prediction methods. Also the values of Delta_e are very small, though their absolute value tends to be slightly larger than that of Delta_b. Interestingly, the Delta_e values are positive, on average, for each prediction method.
Accuracy with which the Domain Boundaries are Identified by Various Prediction Methods
| Method | Pc_c | Delta_b | Delta_e |
|---|---|---|---|
| baker | 56.2 | -1.2(0.3) | 2.2(0.5) |
| chop | 26.1 | -2.9(1.0) | 1.9(0.7) |
| chophomo | 25.0 | -2.6(1.0) | 2.9(1.0) |
| distill | 33.6 | -1.5(0.6) | 3.2(0.8) |
| domfold | 38.0 | -1.9(0.6) | 2.9(0.7) |
| domssea | 42.9 | -1.7(0.6) | 2.5(0.7) |
| dps | 38.7 | -2.2(0.8) | 1.6(0.9) |
| foldpro | 62.8 | -1.3(0.4) | 2.0(0.4) |
| hhpred1 | 43.3 | -2.1(0.5) | 2.6(0.5) |
| hhpred3 | 43.4 | -2.1(0.5) | 2.7(0.5) |
| maopus | 54.2 | -1.4(0.6) | 3.0(0.8) |
| metadp | 39.8 | -1.3(0.7) | 3.3(0.7) |
| NNput | 30.8 | -1.9(0.7) | 2.4(0.8) |
| robetta | 57.9 | -1.0(0.3) | 1.5(0.5) |
The following data are shown: the percentage of domains that are correctly predicted (see text for details) PC_C, the average deviation between the real and the predicted beginning of the domain Delta_b, and the average difference between the real and the predicted end of the domain Delta_e (standard deviations of the mean in parentheses).
This clearly indicates that in the subset of good predictions the domain boundaries are located with very high accuracy. Actually, a deviation of 1-3 residues is probably a very minor mistake in the process of design a protein construct that has, on average, a high probability to be well folded and conformationally homogeneous. It is also interesting to observe that while the Delta_b mean values are negative, the mean Delta_e values are larger than 0, indicating that predicted domains tend to be slightly longer than real domains.
CONCLUSIONS
In the present manuscript we have analyzed the reliability of the predictions that were made in the CASP7 experiment and that are publicly available. It was found that most of the bioinformatics tools are able to determine if a protein is made by a single domain or if it contains more than one domain, despite a similar reliability is reached by considering only the sequence length, a much simpler strategy. Using a standard and well known statistical test, we showed that most of the predictions that can be done are not impressively better than pseudo-random predictions. It was also observed that although the reliability of the prediction methods seems to be insufficient to make them routine tools in experimental structural biology, their performance can be extremely good. When the domain is correctly identified, its boundaries are very close, within one or two residues, to the experimental ones. In conclusion, these bioinformatics applications are not yet sufficiently accurate to be used as routine tools in experimental structural biology. It is rather probable that the use of more than a single prediction method by a sort of consensus approach might improve the reliability of the predictions. Although these bioinformatics tools are still immature, progress can be expected in the future.
This work was supported by the Austrian GEN-AU project BIN-II. Björn Sjöblom and Kristina Djinovic are acknowledged for helpful discussions. Financial support by Putta None is also acknowledged. One reviewer is acknowledged for a series of references that deserved citation.
REFERENCES
[PubMed Link]
[PubMed Link]
[PubMed Link]
[PubMed Link]
[PubMed Link]
[PubMed Link]
[PubMed Link]
[PubMed Link] [PMC Link]
[PubMed Link]
[PubMed Link] [PMC Link]
[PubMed Link]
[PubMed Link]
[PubMed Link]
[PubMed Link]
[PubMed Link]
[PubMed Link]
[PubMed Link]
[PubMed Link]
[PubMed Link]
[PubMed Link]
[PubMed Link]
[PubMed Link]
[PubMed Link]
[PubMed Link]
[PubMed Link]
[PubMed Link]
[PubMed Link]
[PubMed Link]
[PubMed Link]
[PubMed Link]
[PubMed Link]
[PubMed Link]
[PubMed Link]
[PubMed Link]
[PubMed Link]
[PubMed Link] [PMC Link]
[PubMed Link]
[PubMed Link] [PMC Link]
[PubMed Link]
[PubMed Link] [PMC Link]
[PubMed Link]
[PubMed Link]
[PubMed Link]
[PubMed Link]
[PubMed Link]
[PubMed Link]
[PubMed Link]
[PubMed Link]
[PubMed Link]
[PubMed Link] [PMC Link]
[PubMed Link]