All published articles of this journal are available on ScienceDirect.

Spurious Biochemical Results in Plasma Cell Neoplasms - A Study from a Regional Cancer Centre
Abstract
Introduction
Plasma cell neoplasms are characterized by the production of paraproteins. These paraproteins can interfere with routine biochemical assays performed using conventional wet chemistry platforms, leading to erroneous results, misinterpretation, and delays in diagnostic evaluation.
Objective
The objective of this study is to investigate the extent of interference caused by monoclonal proteins (M-proteins) in calcium, magnesium, and phosphate assays, and to quantify the degree and significance of these interferences.
Methods
This is an observational case–control study. Test samples containing M-proteins and control samples without M-proteins were analyzed using both wet chemistry and dry chemistry methods in parallel. Data were evaluated using paired t-tests in the test group and unpaired t-tests in the control group. Passing–Bablok regression and Bland–Altman difference plots were employed to assess method comparison and agreement.
Results
Control samples without paraproteins demonstrated no significant method-related differences in calcium and magnesium assays, whereas a minor method difference was observed for phosphate. In contrast, test samples containing paraproteins exhibited statistically significant interference in calcium, magnesium, and phosphate assays when analyzed using conventional wet chemistry methods.
Discussion
Paraproteins can significantly interfere with biochemical assays (p < 0.05) performed using traditional wet chemistry analyzers. In comparison, dry chemistry platforms demonstrate greater resilience to such interference, thereby offering a more reliable alternative for minimizing paraprotein-induced assay variability in patients with plasma cell neoplasms.
Conclusion
These findings suggest that dry chemistry may serve as a suitable alternative to conventional wet chemistry for minimizing paraprotein-related assay interference.
1. INTRODUCTION
Plasma cell neoplasms encompass a spectrum of disorders, including monoclonal gammopathy of undetermined significance (MGUS), smoldering multiple myeloma (SMM), multiple myeloma (MM), and related entities. These conditions are characterized by abnormal clonal proliferation of plasma cells and the production of monoclonal proteins (M-proteins) [1, 2]. The concentration of M-proteins in circulation can vary widely, ranging from barely detectable levels to markedly elevated amounts [3].
The diagnosis and monitoring of plasma cell neoplasms require a combination of approaches, including routine biochemical assays, serum protein electrophoresis, immunotyping, bone marrow evaluation, and radiological studies. Routine biochemical assays, however, are vulnerable to sample-related interferences, such as hyperbilirubinemia, lipemia, and haemolysis, which have been extensively studied and well-documented. In contrast, paraprotein-induced interference has received limited attention. Although scattered case reports have described instances of biochemical assay interference caused by paraproteins, the underlying mechanisms remain poorly elucidated, and the available literature provides little clarity on how M-proteins impact these tests.
Some studies suggest that paraproteins, particularly immunoglobulin M (IgM), may induce either positive or negative biases in automated chemistry systems [4, 5]. Precipitate formation has been proposed as the most plausible mechanism of interference [4], though its statistical significance has not been comprehensively documented. In practice, such interference often remains unrecognized, resulting in spurious biochemical values, misinterpretation of results, unnecessary additional testing, and delays in diagnostic workup [6]. Increased serum viscosity has also been implicated as a contributing factor in some cases [4, 7].
Interestingly, the Vitros Microslide™ technology appears relatively resistant to paraprotein-induced interference in certain assays, likely due to its larger protein filtration mechanism [8]. This observation provides a strong rationale for comparative studies between conventional wet chemistry platforms and dry chemistry systems to evaluate their reliability in the context of paraprotein interference.
Despite occasional reports, a substantial gap remains in the scientific literature regarding the extent, mechanisms, and statistical significance of paraprotein interference in routine biochemical assays. The present study seeks to address this gap by systematically investigating the phenomenon, thereby contributing to improved diagnostic accuracy and laboratory practice.
We hypothesize that paraproteins significantly interfere with calcium, magnesium, and phosphate assays performed using conventional wet chemistry analyzers, whereas dry chemistry systems demonstrate greater robustness and reliability in minimizing such interference.
The study was performed with the following aims:
1. To determine if there is any interference from monoclonal proteins (M-proteins) in selected biochemical parameters when analyzed using two different biochemical analyzers.
2. To quantify the magnitude and statistical significance of this interference observed between conventional wet chemistry and dry chemistry analytical methods.
The objective of this study is to systematically evaluate the impact of monoclonal proteins (M-proteins) on routine biochemical assays. Specifically, the study seeks to determine the extent, magnitude, and statistical significance of paraprotein-induced interference, and to compare the reliability of conventional wet chemistry and dry chemistry analyzers in minimizing such discrepancies.
2. METHODS
This observational case–control study was conducted in the Biochemistry Laboratory of a regional cancer center in Eastern India, between January 2024 and January 2025.
2.1. Cases
Cases comprised of patients with plasma cell neoplasms and detectable M-protein. Detection and quantification of M-protein were performed using automated capillary electrophoresis on the Sebia CAPILLARYS 3 OCTA™ platform. Patients with non-secretory multiple myeloma (MM), complete response (CR) following treatment, and those with a monoclonal component in the background of a polyclonal pattern were excluded. All patients with detectable M protein by capillary zone electrophoresis were included in the study.
2.2. Controls
Controls were selected from apparently healthy individuals without evidence of plasma cell proliferation or M-protein. This was confirmed by serum protein electrophoresis using the Sebia CAPILLARYS 3 OCTA™ system. All cases included in the study were between 18 and 50 years of age. The control group comprised 20 individuals. All biochemical assays in cases and controls were performed using residual serum samples.
Parameters – All samples from both cases and controls were analyzed on two automated chemistry platforms: the dry chemistry Vitros 4600™ analyzer and the wet chemistry Beckman Coulter DxC AU 700™ analyzer. The assays included calcium, magnesium, and phosphate. Calcium was estimated using the Arsenazo III method, phosphate by the phosphomolybdate reduction method (on both analyzers), while magnesium was measured by the formazan dye method on the Beckman Coulter platform and by the xylidyl blue method on the Vitros platform. Capillary electrophoresis was performed on the Sebia CAPILLARYS 3 OCTA™ system for confirmation of M-protein.
2.3. Scheme of the Study
In the study group, 37 samples were analyzed for calcium, 46 for magnesium, and 29 for phosphate. The number of samples varied according to the clinical test requests made by the hemato-oncologist during OPD or IPD management. Being an observational study, residual samples were utilized, and efforts were made to maximize data collection for each parameter. Sample integrity was maintained throughout (Table 1).
The control group consisted of 20 samples without paraproteins, as confirmed by the absence of an M-protein band on capillary electrophoresis. Venous blood was collected in red-top clot activator vials up to the designated mark, allowed to clot for 30 minutes, and centrifuged at 4000 rpm for 10 minutes. Hemolyzed and grossly lipemic samples were excluded. In addition to routine biochemical assays, serum protein electrophoresis and immunotyping were performed as part of the diagnostic protocol.
To assess M-protein interference in biochemical assays, parallel analyses were performed using two distinct automated platforms: the Beckman Coulter DxC AU 700™ (wet chemistry system) and the Vitros 4600™ (dry chemistry system). In Tables 1A and 1B, the scheme and workflow of the study are presented.
2.4. Instrument validation
Prior to initiating the study, linear regression analysis was conducted between the two analysers to eliminate potential bias related to inter-instrument variability. For this purpose, 20 control samples (without M-protein) were assayed for calcium, magnesium, and phosphate on both systems. The coefficient of determination (R2) was 0.9998 for calcium, 0.9983 for magnesium, and 0.9932 for phosphate, confirming excellent agreement between the two platforms and ensuring interference was not due to inter analyzer variability.
2.5. Statistical Analyses
The following tests were performed:
1. T-test - Paired study for the test group and an unpaired study for the control group.
2. Passing-Bablok regression analysis.
3. Bland-Altman difference plot.
For statistical analysis, GraphPad software was used.
| Category | Details |
|---|---|
| Study design | Observational case–control study conducted from January 2024 to January 2025 |
| Setting | Biochemistry Laboratory, Regional Cancer Center, Eastern India |
| Cases | Patients with plasma cell neoplasm and detectable M-protein (n = 37 for calcium, n = 46 for magnesium, n = 29 for phosphate) |
| Exclusions | Non-secretory MM, treated patients in complete response (CR), patients with a monoclonal component in a polyclonal background |
| Controls | 20 apparently healthy individuals without M-protein, confirmed by serum protein electrophoresis |
| Age group | 18–50 years |
| Sample type | Residual venous serum (OPD and IPD patients) |
| Analyzers used | Beckman Coulter DxC AU 700™ (wet chemistry) and Vitros 4600™ (dry chemistry) |
| Parameters tested | Calcium, Magnesium, Phosphate |
| Assay methods | Calcium – Arsenazo III (both platforms); Magnesium – Formazan dye (Beckman) / Xylidyl blue (Vitros); Phosphate – Phosphomolybdate reduction (both platforms) |
| M-protein detection | Capillary electrophoresis (Sebia CAPILLARYS 3 OCTA™) |
| Sample rejection | Haemolyzed and grossly lipemic samples were excluded. |
| Validation | Linear regression comparison between analysers in 20 control samples showed high agreement (R2 = 0.9998 for calcium, 0.9983 for magnesium, 0.9932 for phosphate) |
| Category/Stage | Details |
|---|---|
| Patient Cohort | Patients with plasma cell neoplasm (Jan 2024 - Jan 2025) |
| Excluded from Patient Cohort | - Non-secretory MM - CR after treatment - Monoclonal + polyclonal pattern |
| Final Study Group Samples Analyzed | - Calcium (n = 37) - Magnesium (n = 46) - Phosphate (n = 29) |
| Control Group | Healthy subjects (n = 20) No M-protein (confirmed by electrophoresis) |
| Sample Collection | Residual serum samples (OPD & IPD) |
| Parallel Analysis | - Beckman Coulter DxC AU 700™ (Wet chemistry) - Vitros 4600™ (Dry chemistry) |
| Parameters Tested | Calcium, Magnesium, Phosphate |
3. RESULTS
Results are shown below with the help of Tables 2-9 and statistical graphs (Figs. 1-4), where Figs. (1 and 3) depict data from the study group, and Figs. (2 and 4) depict data from the control group. Descriptions of tables and figures are not included in the text to avoid duplication.
| Paired t-test Calcium Test DXC AU 700™ (A) Vs VITROS 4600™ (B) | Paired t-test Magnesium DXC AU 700™ (A) Vs VITROS 4600™ (B) | Paired t-test Phosphorus DXC AU 700™ (A) Vs VITROS 4600™ (B) | |||
|---|---|---|---|---|---|
| p-value (two-tailed) | <0.0001 | p-value | 0.0045 | p-value | 0.2135 |
| Significantly different (p < 0.05)? | Yes | Significantly different (p < 0.05)? | Yes | Significantly different (p < 0.05)? | No |
| One- or two-tailed p-value? | Two-tailed | One- or two-tailed p-value? | Two-tailed | One- or two-tailed p-value? | Two-tailed |
| t, df | t=4.741, df=36 | t, df | t=2.964, df=54 | t, df | t=1.273, df=28 |
| Number of pairs | 37 | Number of pairs | 55 | Number of pairs | 29 |
| - | - | - | - | - | |
| How big is the difference? | - | How big is the difference? | - | How big is the difference? | - |
| Mean of differences (A-B) | -0.6297 | Mean of differences (A-B) | +0.15 | Mean of differences (A-B) | +0.1448 |
| SD of differences | 0.8079 | SD of differences | 0.3002 | SD of differences | 0.6127 |
| SEM of differences | 0.1328 | SEM of differences | 0.04049 | SEM of differences | 0.1138 |
| 95% confidence interval | 0.3604 to 0.8991 | 95% confidence interval | -0.2012 to -0.03883 | 95% confidence interval | -0.3779 to 0.08824 |
| R-squared (partial eta squared) | 0.3844 | R-squared (partial eta squared) | 0.1399 | R-squared (partial eta squared) | 0.0547 |
| % of difference between means (A-B) | -6.9% | - | +7.4% | - | +3.7% |
| How effective was the pairing? | - | How effective was the pairing? | - | How effective was the pairing? | - |
| Correlation coefficient (r) | 0.9147 | Correlation coefficient (r) | 0.7604 | Correlation coefficient (r) | 0.7471 |
| p-value (one-tailed) | <0.0001 | p-value (one-tailed) | <0.0001 | p-value (one-tailed) | <0.0001 |
| Unpaired t-test for Calcium in Samples without Paraproteins DXC AU 700™(A) Vs VITROS 4600™ (B) | Unpaired t-test for Magnesium in Samples without Paraproteins DXC AU 700™ (A) Vs VITROS 4600™ (B) | Unpaired t-test for Phosphorus in Samples without Paraproteins DXC AU 700™ (A) vs VITROS 4600™ (B) | |||
|---|---|---|---|---|---|
| p-value | 0.3009 | p-value | 0.2918 | p-value | 0.415 |
| p-value summary | ns | p-value summary | ns | p-value summary | ns |
| Significantly different (p < 0.05)? | No | Significantly different (p < 0.05)? | No | Significantly different (p < 0.05)? | No |
| One- or two-tailed P- value? | Two-tailed | One- or two-tailed p-value? | Two-tailed | One- or two-tailed p-value? | Two-tailed |
| t, df | t=1.049, df=38 | t, df | t=1.069, df=38 | t, df | t=0.8242, df=38 |
| N (number of samples) | 30 | - | 30 | - | 30 |
| How big is the difference? | - | How big is the difference? | - | How big is the difference? | - |
| Mean of column A | 8.58 | Mean of column A | 2.035 | Mean of column A | 3.74 |
| Mean of column B | 8.305 | Mean of column B | 1.92 | Mean of column B | 4.02 |
| Difference between means (B - A) ± SEM | -0.2750 ± 0.2622 | Difference between means (B - A) ± SEM | -0.1150 ± 0.1076 | Difference between means (B - A) ± SEM | 0.2800 ± 0.3397 |
| 95% confidence interval | -0.8058 to 0.2558 | 95% confidence interval | -0.3328 to 0.1028 | 95% confidence interval | -0.4078 to 0.9678 |
| R-squared (eta squared) | 0.02814 | R-squared (eta squared) | 0.0292 | R-squared (eta squared) | 0.01756 |
| % of difference between means | -.3.2% | - | -5.7% | - | 7.5% |
| F test to compare variances | - | F test to compare variances | - | F test to compare variances | - |
| F, DFn, Dfd | 1.023, 19, 19 | F, DFn, Dfd | 1.129, 19, 19 | F, DFn, Dfd | 1.089, 19, 19 |
| p-value | 0.9603 | p-value | 0.7941 | p-value | 0.8539 |
| p-value summary | ns | p-value summary | ns | p-value summary | ns |
| Significantly different (p < 0.05)? | No | Significantly different (p < 0.05)? | No | Significantly different (p < 0.05)? | No |
| Passing Bablok Regression Correlation Test for Samples with Paraproteins for Calcium on DXC AU 700™(A) Vs V4600™ Calcium (B) | Passing Bablok Regression Correlation Test for Samples with Paraproteins for Magnesium on DXC AU 700™ (A) Vs V4600™ Magnesium (B) | Passing Bablok Regression Correlation Test for Samples with Paraproteins for Phosphorus on DXC AU 700™ (A) Vs V4600™ Phosphorus (B) | |||
|---|---|---|---|---|---|
| (A) | (B) | (A) | (B) | (A) | (B) |
| Mean Calcium 9.138 mg/dL | 9.768 mg/dL | Mean Magnesium 2.020 mg/dL | 1.87 mg/dL | Mean Phosphorous 3.952 mg/dL | 3.807 mg/dL |
| Intercept | 0.27 (-0.84 to 1.19) | Intercept | -0.28 (-1.08 to -0.10) | intercept | 0.50 (-0.63 to 1.75) |
| Slope 1.029 | 95% CL (0.933 to 1.158) | Slope | 1.091 (1.0 to 1.5) | Slope | 0.846 (0.5 to 1.143) |
| Proportional Bias based on Slope for VITROS 4600™ | 2.9% (- 6.7% to 11.6%) | Proportional Bias based on average Slope | 9.10% | Proportional Bias based on average Slope | -15.40% |
| SD 1.998 | 1.805 | SD 0.4246 | 0.4709 | SD 0.8613 | 0.8619 |
| Min 6.6 | min 7.0 | Min 1.1 | min 1.2 | Min 2.5 mg/dL | min 2.6 mg/dL |
| Max 17 | Max 14.5 | Max 3.3 | Max 3.2 | Max 6.0 mg/dL | Max 6.8 mg/dL |
| R | 0.915 | R | 0.798 | R | 0.747 |
| N | 37 | N | 46 | N | 29 |
| Bland-Altman Difference plot data (Bias) (B-A) | - | Bland-Altman Difference plot data (Bias) (B-A) | - | Bland-Altman Difference plot data (Bias) (B-A) | - |
| Mean difference (B-A) | 0.63 mg/dL (6.9%) | Mean difference (B-A) | -0.15 mg/dL (-7.4%) | Mean difference(B-A) | -0.145 mg/dL (-3.7%) |
| 95% CL | -0.36 to -0.90 mg/dL | 95% CL | -0.236 to -0.064 mg/dL | 95% CL | -0.378 to 0.088 mg/dL |
| %Range of 95% CL | (3.9% to 9.8%) | %Range of 95% CL | (-11.7% to -3.2%) | % Range of 95% CL | -9.6% to 2.2%) |
| BV TE(a) Desirable limit Calcium 2.55% (Minimum 3.6%) | BV Bias (a) Desirable limit Calcium 0.82% | BV TE(a) Desirable limit for Magnesium 4.8% (Minimum 7.2%) | BV Bias(a) Desirable limit Magnesium 1.8% | BV TE(a) Desirable limit Phosphorous 10.1% | BV Bias(a) Desirable limit Phosphorous 3.38% |
Abbreviations: [SD=standard deviation, SEM=Standard error of the mean, TE(a)=total allowable error, BV: Biological variation].
| Control Group Passing Bablok Regression Correlation for Calcium Beckman DXC AU 700™ (A) Vs VITROS 4600™ (B) | Control Group Passing Bablok Regression Correlation for Magnesium Beckman DXC AU 700™ (A) Vs VITROS 4600™(B) | Control Group Passing Bablok Regression Correlation for Phosphorus Beckman DXC AU 700™(A) Vs VITROS 4600™(B) | |||
|---|---|---|---|---|---|
| Mean 8.58 mg/dL(A) | 8.305 mg/dL (B) | Mean Magnesium 2.035 mg/dL(A) | 1.92 mg/dL(B) | Mean Phosphorous 3.740 mg/dL(A) | 4.020 mg/dL(B) |
| Intercept | -0.30 (-0.66 to 0.29) | Intercept | -0.10 (-0.53 to -0.10) | intercept | 0.44 (0.3 to 0.56) |
| Slope | 1.0 (0.938 to 1.043) | Slope | 1.0 (1.0 to 1.20) | Slope | 0.952 (0.913 to 1.000) |
|
Proportional Bias based on the average slope |
0% | Proportional Bias based on average slope | 0% | Proportional Bias based on average slope | 5% |
| SD 0.8339 | 0.8243 | SD 0.3297 | 0.3503 | SD 1.097 | 1.051 |
| Min 6.8 mg/dL | min 6.5 mg/dL | Min 1.6 mg/dL | min 1.5 mg/dL | Min 2.4 mg/dL | min 2.8 mg/dL |
| Max 9.9 mg/dL | Max 9.6 mg/dL | Max 3.0 mg/dL | Max 2.9 mg/dL | Max 6.8 mg/dL | Max 6.9 mg/dL |
| R | 0.994 | R | 0.982 | R | 0.997 |
| N | 20 | N | 20 | N | 20 |
| Bland Altman Difference plot data | - | Bland Altman Difference plot data | - | Bland Altman Difference plot data | - |
| Mean difference (B-A) | -0.275 mg/dL (-3.2%) | Mean difference (B-A) | -0.115 mg/dL (-5.7%) | Mean difference (B-A) | 0.28 mg/dL (7.5%) |
| 95% CL | -0.318 to -0.232 mg/dL | 95% CL | -0.146 to -0.0836 mg/dL | 95% CL | 0.235 to 0.325 mg/dL |
| % range of 95% CL | -3.7% to -2.7% | % range of 95% CL | -7.17% to -4.1% | % range of 95% CL | 6.3% to 8.7% |
| BV TE(a) Desirable limit Calcium 2.55% | BV Bias (a) Desirable limit Calcium 0.82% | BV TE(a) Desirable limit for Magnesium 4.8% | BV Bias(a) Desirable limit Magnesium 1.8% | BV TE(a) Desirable limit Phosphorous 10.1% | BV Bias(a) Desirable limit Phosphorous 3.38% |
| Constant Bias includes Calibration differences | Remarks: Proportional bias probably due to method difference | ||||
| Analyte | TE(a)% | Allowable Bias% | Imprecision (CV%) |
|---|---|---|---|
| Calcium | 2.55 | 0.82 | 1.05 |
| Magnesium | 4.8 | 1.8 | 1.8 |
| Phosphorus | 10.11 | 3.38 | 4.08 |
| Statistical Analysis Parameter | Characteristic of the Parameter | Test Group | Control Group | Cut off for Significance or Allowable Limits |
|---|---|---|---|---|
| p-value in t-test (two-tailed) | Significance of the difference in values in two directions (positive and negative bias) | <0.0001 | 0.3009 | p <0.05 for 95% CL, p <0.01 for 99% CL |
| p-value in t-test (one-tailed) | Significance of the difference in values in one direction | <0.0001 | 0.9603 | p <0.05 for 95% CL, p <0.01 for 99% CL |
| R2 in t-test | Value between 0 and 1; Low value denotes little variance in results between the methods and vice versa | 0.3844 | 0.02814 | An R2value of >0.3 is required to imply the analyzer/method to explain the significant difference (Matthias reference) |
|
Difference in means in t-test (A-B) |
Indicates the average bias between the analyzer methods (% bias can be calculated based on the mean value in the study) |
-0.6297 Mean 9.5 mg/dL (-6.6%) |
+0.2750 Mean 8.58 mg/dL (+3.2%) |
Allowable Bias 0.82%* |
| Slope – 1 from Passing Bablok regression regression | Indicates proportional Bias between the analyzer methods for the test | 0.029 (2.9%) | 0.000 (0%) | Allowable TE(a) 2.55%* |
| Bias % from Bland Altman plot (B-A) | Indicates the average difference in values between the analyzer methods (% bias can be calculated based on the mean value in the study) |
0.63 mg/dL (6.9%) |
-0.275 mg/dL (-3.2%) |
Allowable Bias 0.82%* |
| Significance of the Difference in Values between the Analyzer Methods in one Direction | Characteristic of the Parameter | Test Group | Control Group | Allowable Shift based on TE(a) or % Bias based on BV (desirable limits) * |
|---|---|---|---|---|
|
p-value in t-test (two-tailed) |
Significance of the difference in values between the analyzer methods in both directions (positive and negative bias) | 0.0045 | 0.2918 | p <0.05 for 95% CL, p <0.01 for 99% CL |
|
p-value in t-test (one-tailed) |
Significance of the difference in values between the analyzer methods in one direction | <0.0001 | 0.7941 | p <0.05 for 95% CL, p <0.01 for 99% CL |
| R2 in t-test | Value between 0 to 1; Low value denotes little variance in results between the methods and vice versa | 0.1399 | 0.0292 | Generally, a 30% variance is explainable by the reagent method difference |
|
Difference in means in t-test (A-B) |
Indicates the average bias between the analyzer methods (% bias can be calculated based on the mean value in the study) |
0.15 Mean 2.02 (+7.4%) |
-.1150 Mean 2.024 (+5.7%) |
Allowable Bias 1.8% |
| Slope – 1 from Passing Bablok regression | Indicates proportional Bias between the analyzer methods for the test | 0.091 (9.1%) | 0.00 (0.00%) | Allowable TE(a) 4.8% |
| Bias % from Bland Altman plot (B-A) | Indicates the average difference in values between the analyzer methods (% bias can be calculated based on the mean value in the study) |
-0.15 mg/dL (-7.4%) |
-0.115 mg/dL (-5.7%) |
Allowable Bias 1.8% |
| Statistical Analysis Parameter | Characteristic of the Parameter | Test Group | Control Group | Allowable Shift based on TE(a) or % Bias based on BV (desirable limits) * |
|---|---|---|---|---|
|
p-value in t-test (two-tailed) |
Significance of the difference in values between the analyzer methods in both directions (positive and negative bias) | 0.2135 | 0.415 | p <0.05 for 95% CL, p <0.01 for 99% CL |
| p-value in t-test (one-tailed) | Significance of the difference in values between the analyzer methods in one direction only | <0.0001 | 0.8539 | For 99% CL, a significant threshold for p-value is < 0.01 (Rebecca Bevans) |
| R2 in t-test | Value between 0 to 1; Low value denotes little variance in results between the methods and vice versa | 0.0547 | 0.01756 | Generally, a 30% variance is explainable by the reagent method difference |
|
Difference in means in t-test (A-B) |
Indicates the average bias between the analyzer methods (% bias can be calculated based on the mean value in the study) |
+0.1448 Mean 3.95 (+3.7%) |
-0.2800 Mean 3.74 (-7.5%) |
Allowable Bias 3.38% |
| Slope – 1 from Passing Bablok regression | Indicates proportional Bias between the analyzer methods for the test |
-0.154 (-15.4%) |
0.952 (9.52%) |
Allowable TE(a) 10.11% |
| Bias % from Bland Altman plot (B-A) | Indicates the average difference in values between the analyzer methods (% bias can be calculated based on the mean value in the study) |
-0.145 mg/dL -3.7% |
0.28 mg/dL (7.5%) |
Allowable Bias 3.38% |
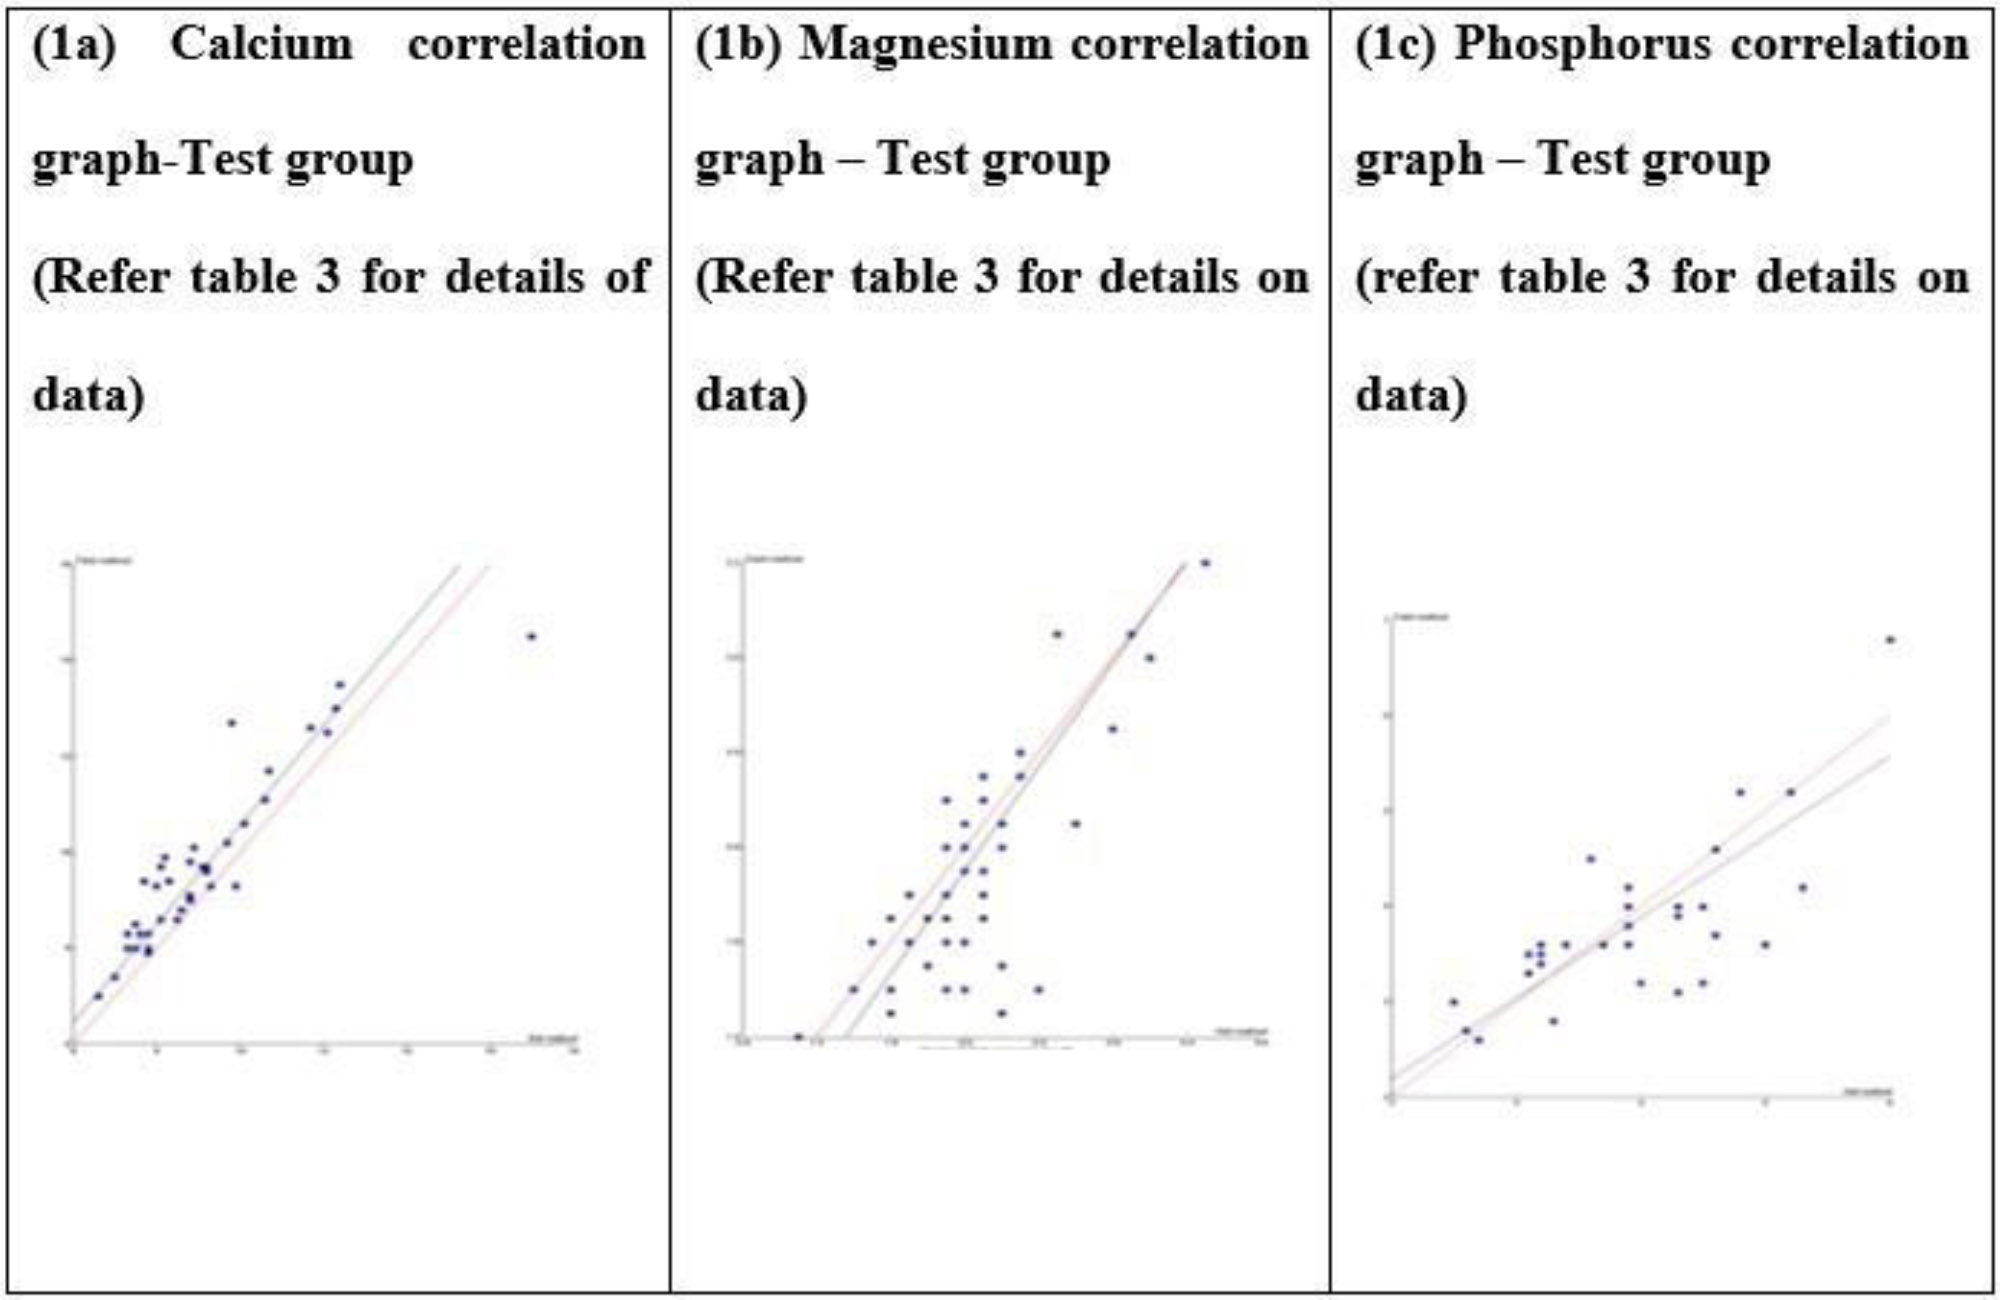
Study Test group Passing Bablok regression correlation graph (1a-c) – Beckman DXC AU 700 Vs VITROS V4600 in samples containing paraproteins: Field method is VITROS V4600 and reference method is Beckman DXC AU 700.
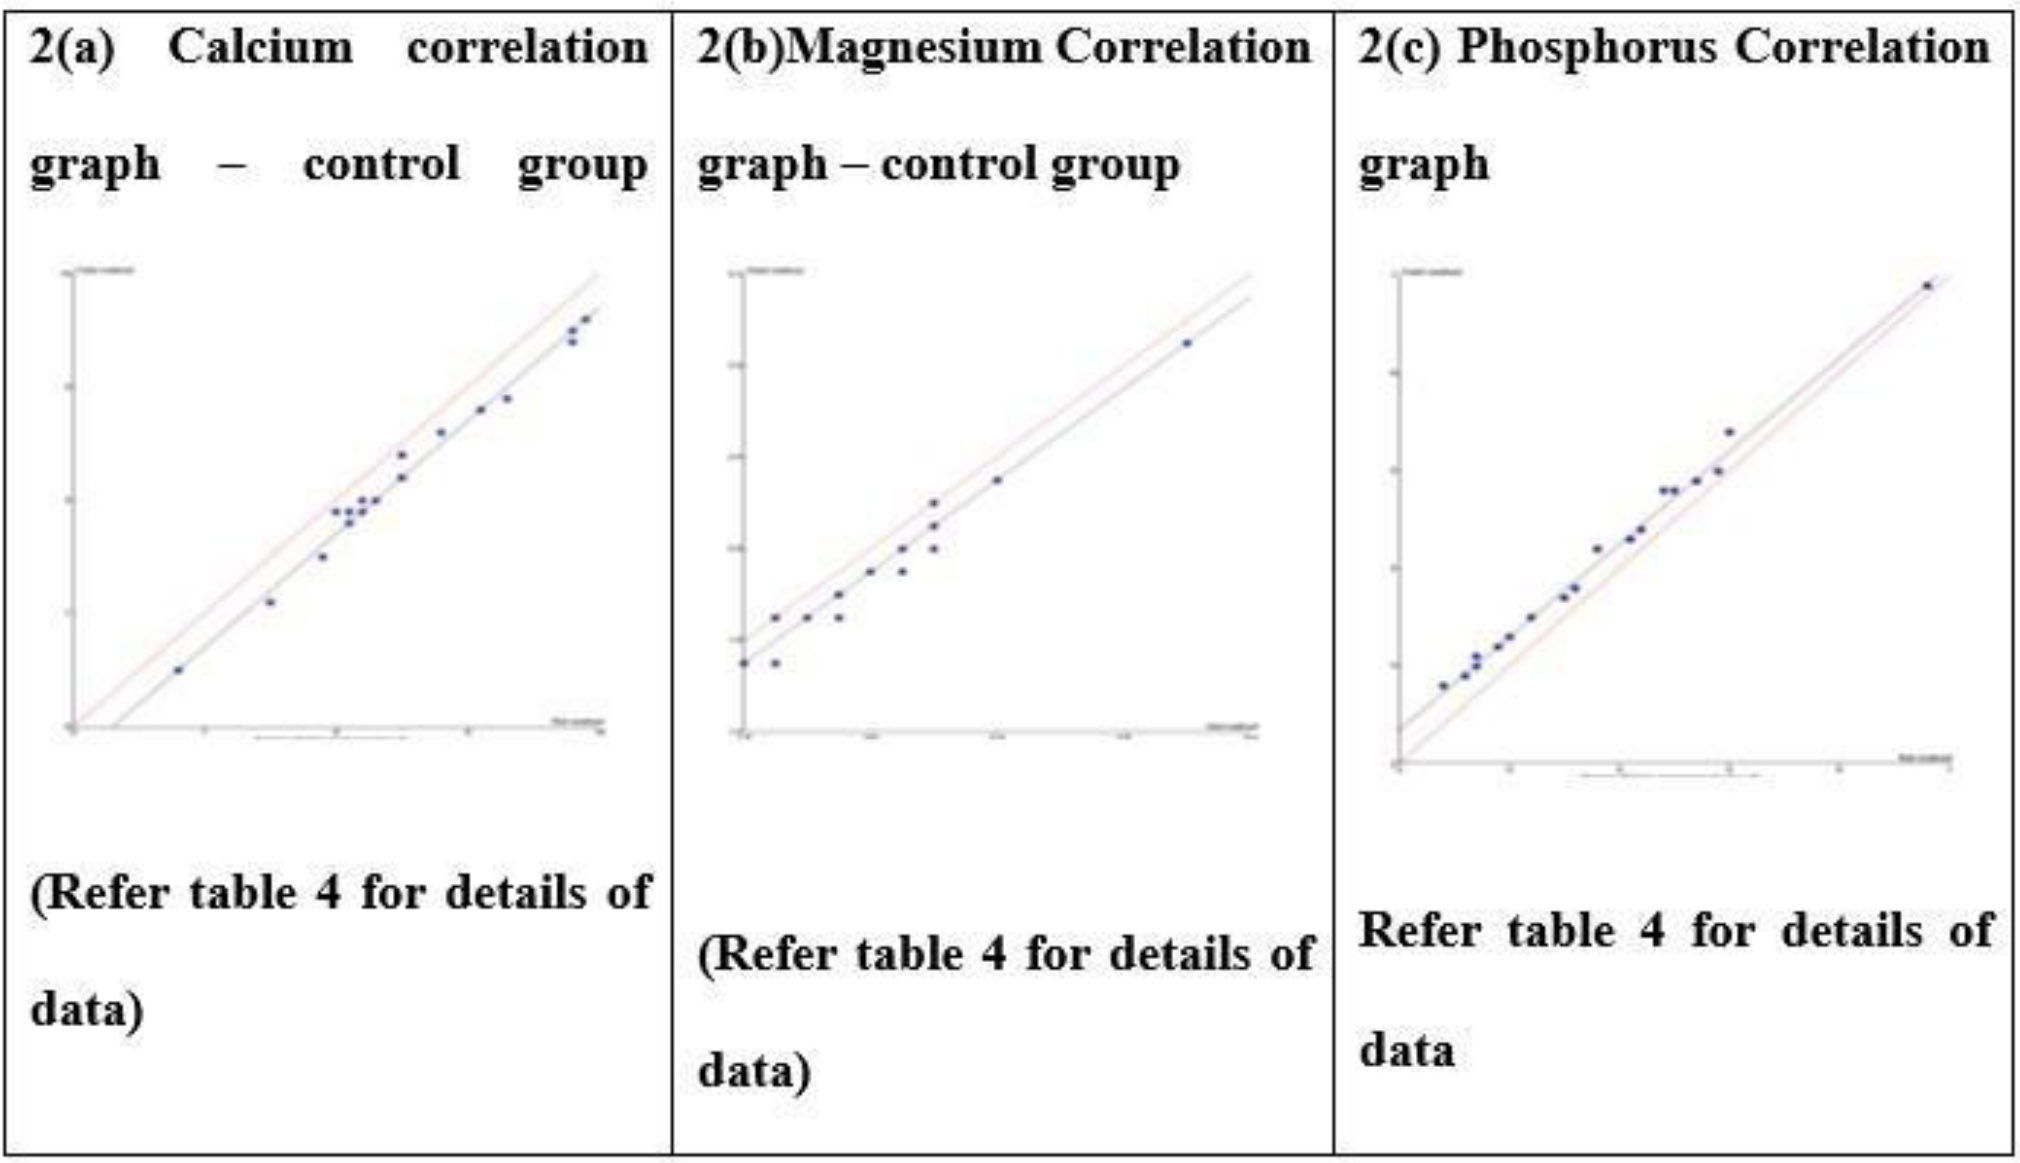
Control group Passing-Bablok regression correlation graph (2a-c) – Beckman DXC AU 700 Vs VITROS V4600 in samples without paraproteins. The field method is VITROS V4600, the Reference method is DXC AU 700.
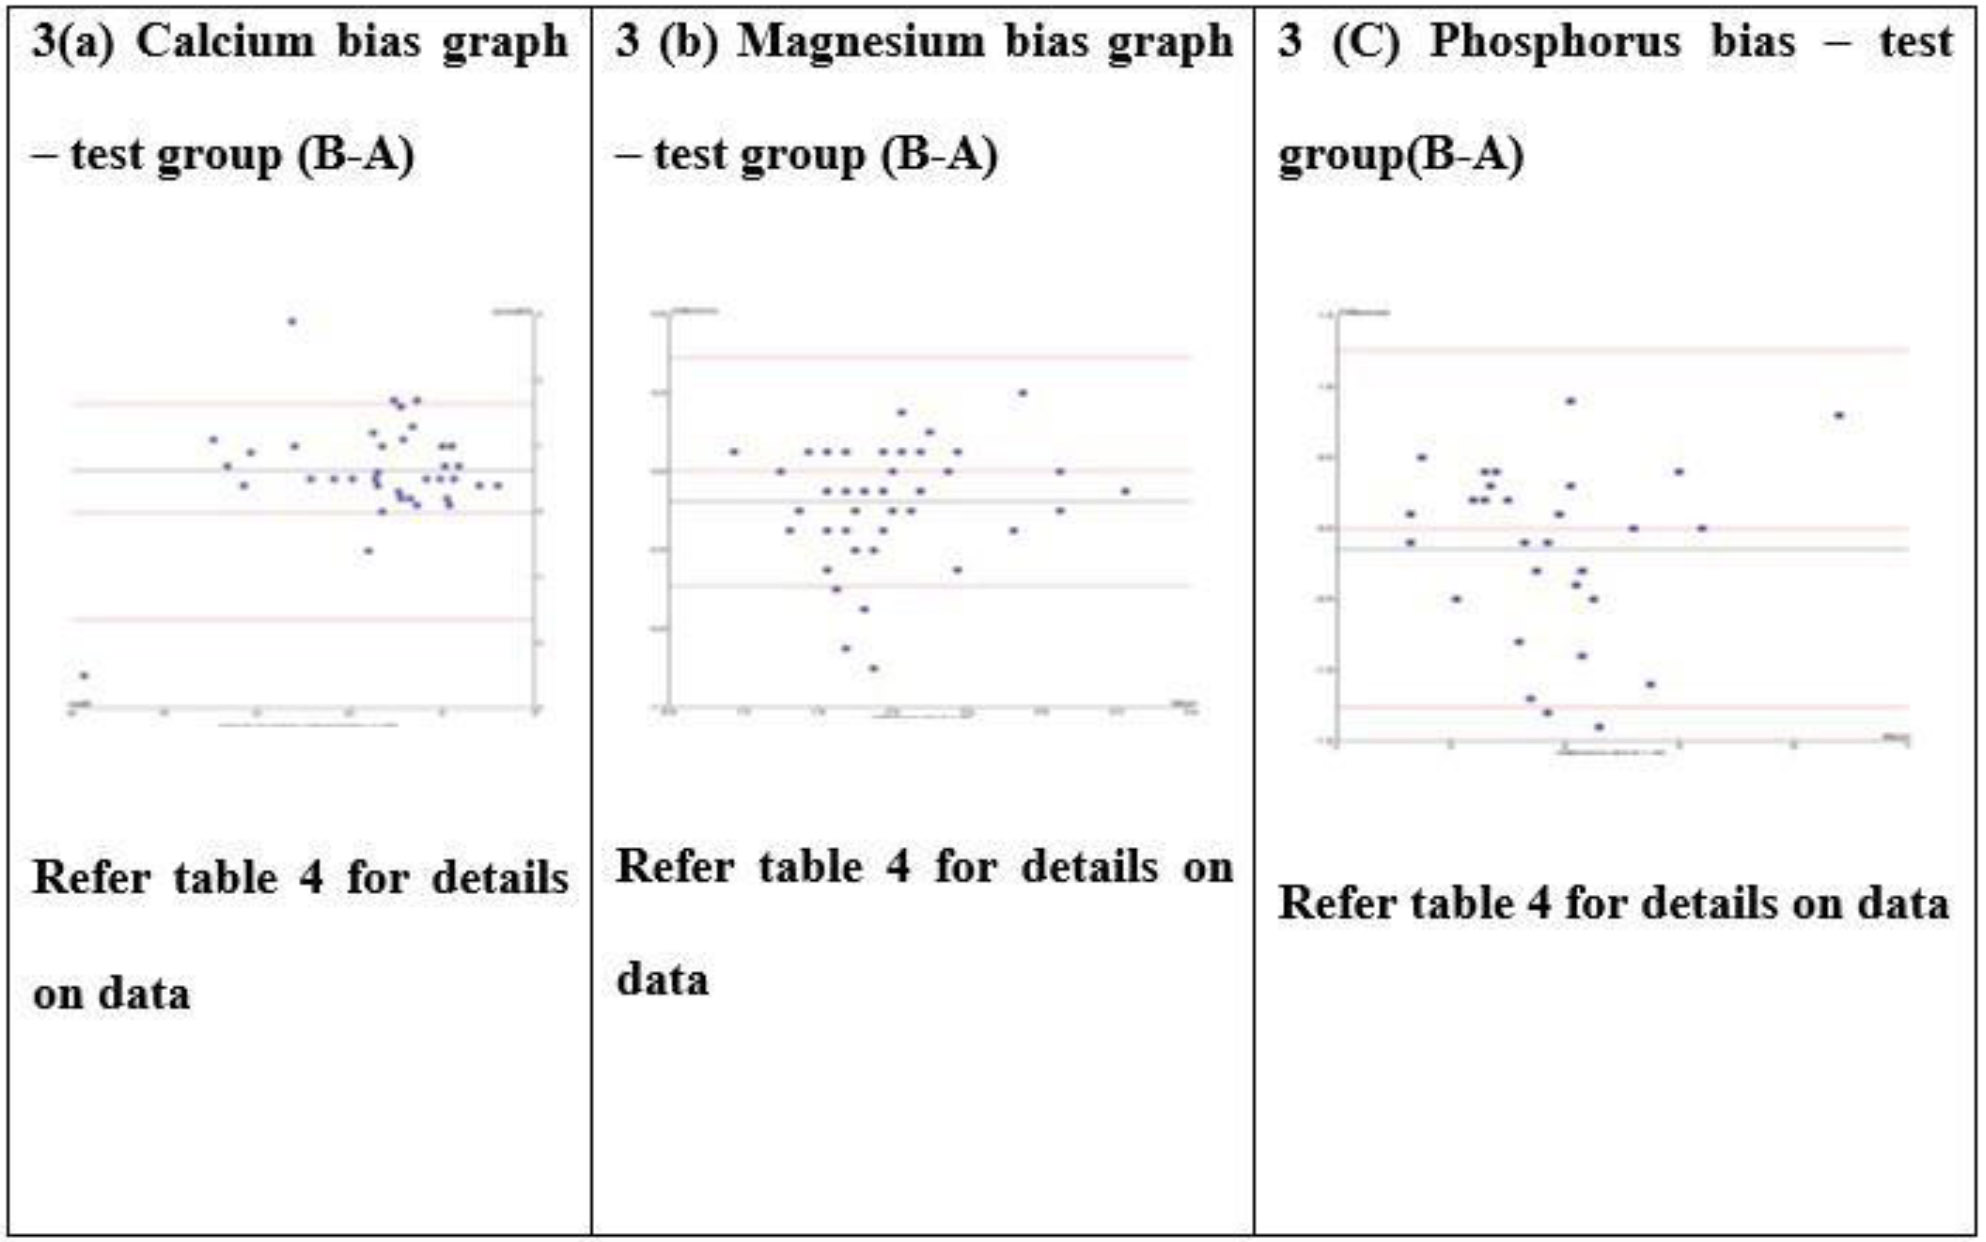
Test group Bland-Altman bias graph for calcium, magnesium, and phosphorus test (3a-c).
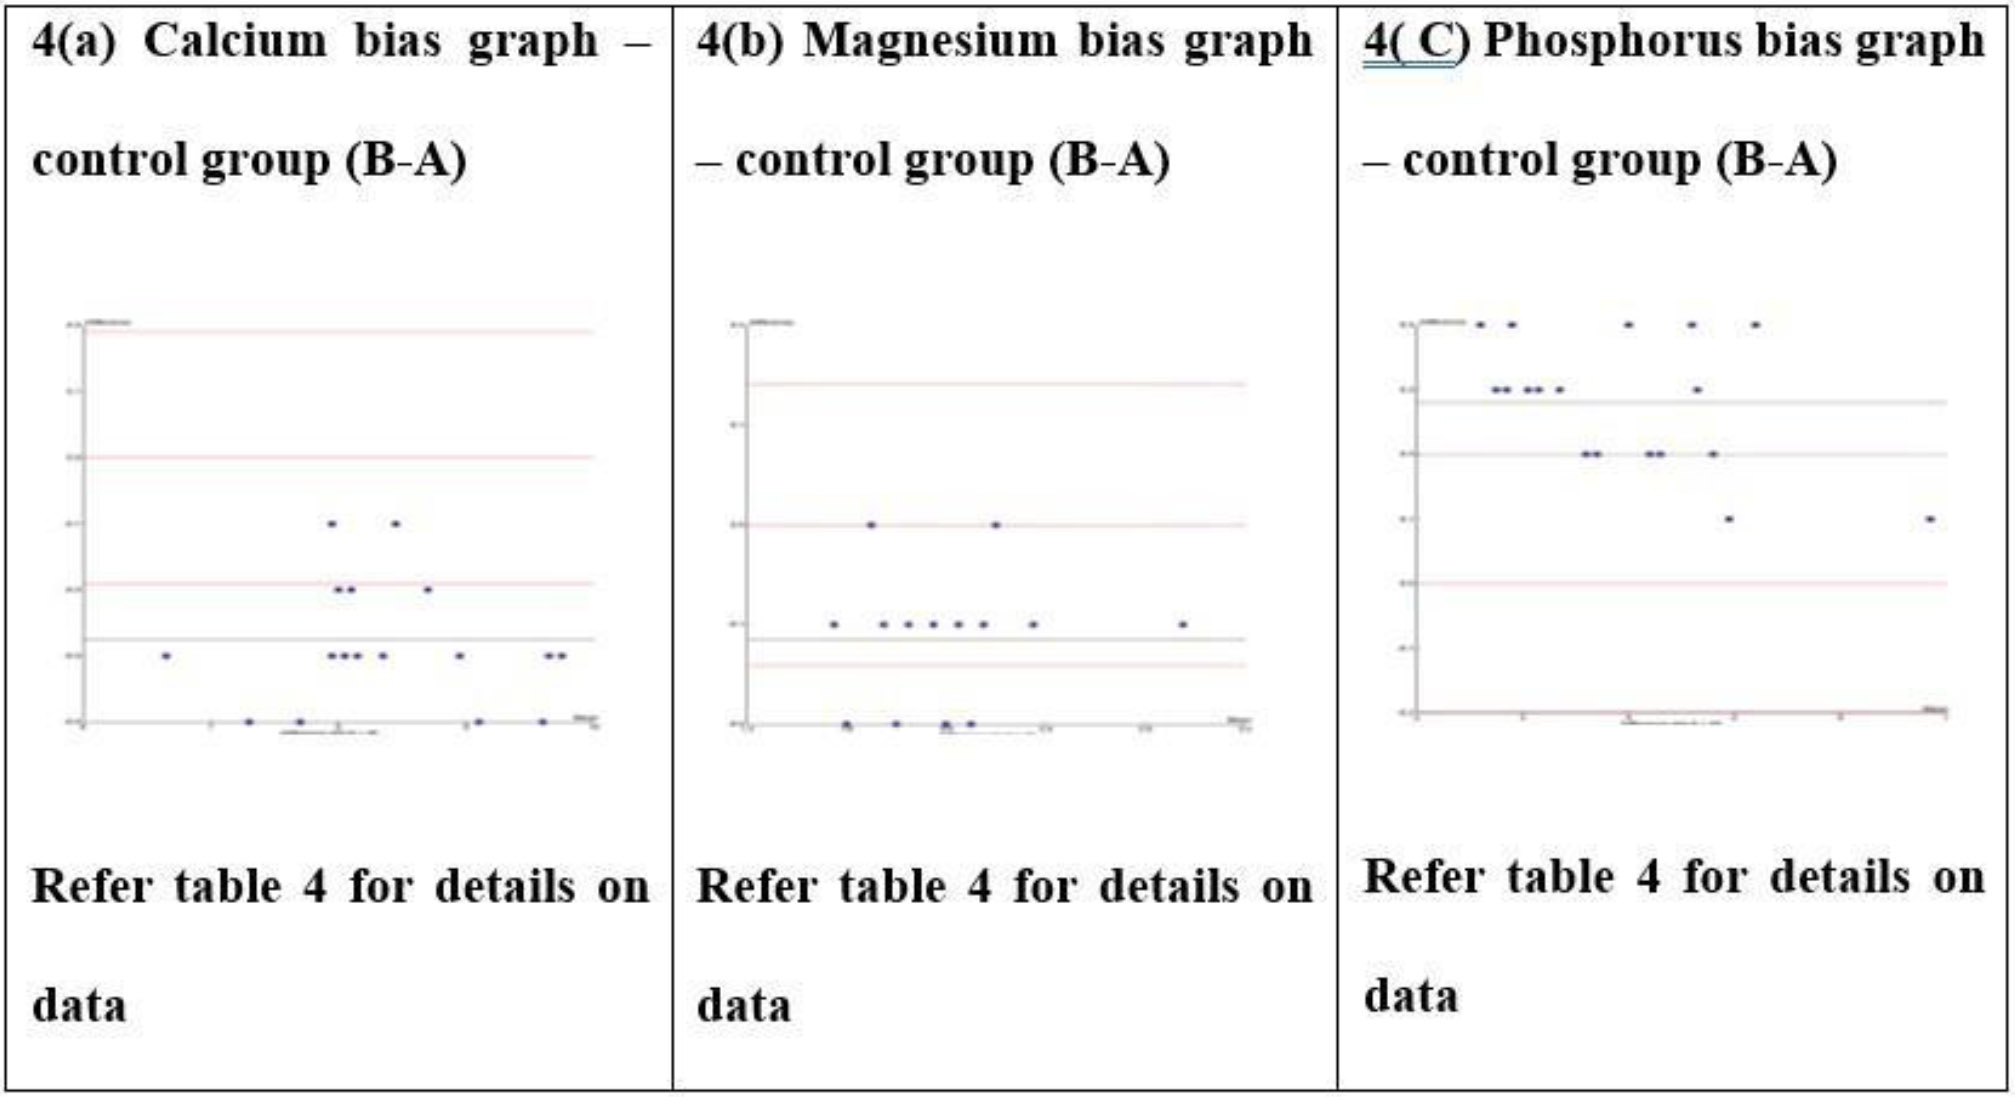
Control group Bland-Altman bias graph for calcium, magnesium, and phosphorus tests (4a-c).
The one-tailed p-value and two-tailed p-value for calcium were <0.001 and <0.001, respectively. For magnesium, the one-tailed p-value and two-tailed p-value were <0.0001 and <0.05. For phosphorus, they were <0.0001 and 0.2135, respectively.
Very low R2 values were observed in the control group (samples without paraproteins), namely 0.028, 0.029, and 0.018 for calcium, magnesium, and phosphorus, respectively (Tables 3, 5, and 9). In contrast, in the test group (samples with paraproteins), the R2 values were 0.3844 for calcium, 0.1399 for magnesium, and 0.0547 for phosphorus.
Passing–Bablok regression and Bland–Altman difference plot analyses for comparison of the two methods were conducted and are explained below.
4. DISCUSSION
The summary of statistical data is elaborated below to describe and compare the observations, analyte-wise, between the study group and control group samples for each statistical parameter, namely:
I. Significance of difference between study and control groups, i.e., p-value.
II. R2 values from paired and unpaired tests.
III. Average constant bias, using difference in means and Bland–Altman difference plot.
IV. Proportional bias, assessed using Passing–Bablok regression.
4.1. Significance of the Difference between the Study and the Control Groups
4.1.1. Observations of Two-tailed and One-tailed p-values in the Study
In the control group, no significant differences were observed between the reference method (VITROS 4600™) and the field method (Beckman DXC AU 700™) when samples without paraproteins were analyzed (Table 3). For calcium, magnesium, and phosphorus, the two-tailed p values were 0.3009, 0.2918, and 0.415, respectively, while the corresponding one-tailed p values were 0.9603, 0.7941, and 0.8539. These results indicate that in the absence of paraproteins, both analyzers perform comparably across all three tests. Therefore, any significant bias observed in other contexts cannot be attributed to inherent method differences.
In the study group, calcium and magnesium assays demonstrated statistically significant differences, with two-tailed p-values of <0.001 and 0.0045, and one-tailed p-values of <0.0001 for both. This indicates that the presence of paraproteins introduces marked discrepancies between the two methods, with values deviating consistently in a single direction. Specifically, calcium demonstrated a significant negative bias of –6.9% with Beckman DXC AU 700™ (exceeding the desirable bias limit of 0.82%), while magnesium showed a significant positive bias of 7.4% (exceeding the desirable limit of 1.8%) Tables 2, 6 & 9).
For phosphorus, the two-tailed p-value (0.2135) was not significant; however, the one-tailed p-value (<0.0001) was significant. This suggests that paraproteins produce directional differences, though the net bias of 3.7% in the positive direction is less pronounced. Importantly, this value marginally exceeds the maximum allowable bias based on biological variation (3.38%) (Tables 2, 6, and 9).
4.1.2. Observations on R2 and r for the Three Analytes
A low R2 in the control group with a higher value in the study group would suggest that the variance is attributable to factors present in the latter, namely paraproteins [9-13]. In the control group, R2 values were very low (0.028, 0.029, and 0.018 for calcium, magnesium, and phosphorus, respectively) (Tables 3, 5, and 9). In contrast, the study group showed higher R2 values: 0.3844 for calcium, 0.1399 for magnesium, and 0.0547 for phosphorus. These findings indicate that paraproteins contribute progressively to assay variance, with the most pronounced effect observed in calcium.
The corresponding correlation coefficients (r) were 0.747 for phosphorus, 0.760 for magnesium, and 0.915 for calcium, suggesting greater consistency in calcium results across the measurement range. By contrast, magnesium and phosphorus displayed less consistent patterns. This raises the need for further investigation into the influence of varying M-protein concentrations on magnesium and phosphorus assays.
4.1.3. Difference in Means vs. Bland–Altman Difference Plot
The mean difference expressed as % bias, calculated in Tables 2 and 3, reflects the average bias between the two analyzers. The Bland–Altman difference plot provides a comparable metric for estimating method bias. In this study, the biases estimated from the Bland–Altman plots were consistent with those obtained from the unpaired t-test, supporting the robustness of the findings.
4.1.4. Proportional Bias Using Passing–Bablok Regression
The slope of Passing–Bablok regression represents the proportional difference between VITROS 4600™ and Beckman DXC AU 700™, with a slope approaching 1.0 indicating minimal proportional bias.
- Calcium: The slope was 1.029, indicating a proportional positive bias. With a Total Allowable Error (TEa) of 2.55%, the observed bias exceeded acceptable limits, implying that the two methods cannot be used interchangeably without correction.
- Magnesium: The slope was 1.091, reflecting a proportional positive bias. The observed bias exceeded the TEa of 4.8%, again indicating non-interchangeability of the two methods without adjustment.
- Phosphorus: The slope was 0.846, corresponding to a proportional negative bias of –15.4% compared with the reference method. As this bias exceeded the TEa of 10.1%, the methods cannot be considered interchangeable for phosphorus without calibration or correction.
| Serial No | Author | Year | Country | Title | Conclusions |
|---|---|---|---|---|---|
| 1. | Kroll & Elin [14] | 1994 | USA | Interference with Clinical Laboratory Analyses | Interferences by endogenous substances, including paraproteins, affect assay results. It is important to distinguish between analyte-dependent and independent interferences. Methods for detection and resolution are discussed. |
| 2. | Sinclair et al. [15] | 2004 | UK | Spurious hyperphosphataemia caused by an IgA paraprotein: a topic revisited | IgA paraproteins can cause occasional interference, producing pseudohyperphosphataemia in some assay methods; however, it is not a major clinical problem on most instruments. |
| 3. | Yang et al. [16] | 2008 | USA | Paraproteins are a common cause of interference with automated chemistry methods | Paraprotein interference is relatively common in bilirubin and HDL-C assays; interferences are method- and concentration-dependent. Monitoring absorbance curves helps detect interference. |
| 4. | King & Florkowski [17] | 2010 | New Zealand | How paraproteins can affect laboratory assays: spurious results and biological effects | Paraproteins cause various analytical and pre-analytical interferences in clinical chemistry; detection and awareness are crucial. Some effects include precipitation, binding interference, and pseudohyponatraemia. |
| 5. | SarkarR [18] | 2024 | India | Paraprotein interferences: Insights from a short study involving multiple platforms and multiple measurands | Paraprotein interferences are fairly common, especially on wet chemistry platforms for measurands such as Direct Bilirubin, HDL-Cholesterol, Iron, and UIBC; reaction curve monitoring is important for detection and prevention. |
In contrast, passing–Bablok regression applied to control samples (without paraproteins) revealed slopes of 1.000 for calcium and magnesium, corresponding to 0% proportional bias, and a slope of 0.952 for phosphorus, indicating a minor negative bias (–4.8%) that remained within the TEa. Thus, in the absence of paraproteins, both methods demonstrate acceptable agreement.
To summarise, it can be mentioned that in the presence of paraproteins, proportional differences were minimal for calcium, but pronounced for magnesium and phosphorus. In control samples, proportional bias was absent for calcium and magnesium, whereas phosphorus exhibited a slight but acceptable difference. Table 10 depicts the summary of previous studies.
CONCLUSION
Paraproteins caused negligible interference in calcium estimation but had notable effects on magnesium and phosphorus levels. In controls, calcium and magnesium showed no bias, while phosphorus showed a minor acceptable variation. These findings suggest that dry chemistry may serve as a suitable alternative to conventional wet chemistry for minimizing paraprotein-related assay interference.
The study is limited by its small sample size and short duration. Only three biochemical parameters were analysed, and interference was not quantified relative to the concentration of paraproteins.
Therefore, further studies with larger sample sizes, extended study duration, and inclusion of additional biochemical parameters are warranted. Future investigations should also assess the effect of varying paraprotein concentrations on assay interference.
AUTHORS’ CONTRIBUTIONS
Both authors contributed equally to the project. G.C.: Worked on the conceptualization of the study, laboratory work, statistical analysis, and other aspects of the project; B.D.: Worked on manuscript preparation, result analysis, and revision of the manuscript, as well as other relevant aspects.
LIST OF ABBREVIATIONS
| BV | = Biological Variation |
| df | = Degree of Freedom |
| DFd | = The Denominator Degrees of Freedom |
| DFn | = The Numerator Degrees of Freedom |
| IgM | = Immunoglobulin M |
| MGUS | = Monoclonal Gammopathy of Undetermined Significance |
| MM | = Multiple Myeloma |
| M-proteins | = Monoclonal proteins |
| r | = correlation coefficients |
| SD | = Standard Deviation |
| SEM | = Standard Error of the Mean |
| SMM | = Smoldering Multiple Myeloma |
| t | = The ratio of the mean difference between the paired observations to the standard error of that difference |
| TE | = Total Error |
| TEa | = Total Allowable Error |
AVAILABILITY OF DATA AND MATERIALS
The data and supportive information are available within the article.
ACKNOWLEDGEMENTS
The authors would like to thank their laboratory technicians, Mr. Tapas Sardar and Mr. Shambu Ghosh.