All published articles of this journal are available on ScienceDirect.

Erythrocyte miRNA 144 and miRNA 451 as Cell Aging Biomarkers in African American Adults
Authors Info & Affiliations
Abstract
Objective:
MicroRNAs (miRNA) are novel critical regulators of cell proliferation and human disease, including diabetes mellitus and cancer. The aim of this study was to evaluate the expression of circulating erythrocytes (E) miRNA-144 and miRNA-451 expression in African Americans Adults (AAA) as a biomarker of cell aging.
Methods:
The blood samples were collected from healthy controls [n=9] following an 8-12 hours fast. Erythrocytes were purified twice by Boyum gradient. Erythrocytes were further sub-fractionated into young (y) (1.07-1.09 g/ml), mid (m) (1.09- 1.11 g/ml), and old (o) (1.11-1.12 g/ml) age cells by using discontinuous Percoll gradient (35%, 40%, 45%, 50%, 55%, 65%, 80%, and 100%) and total RNA extracted. MiRNA-144 and miRNA-451 were quantified in y, m, and o age E sub-fractions by qRT-PCR.
Results:
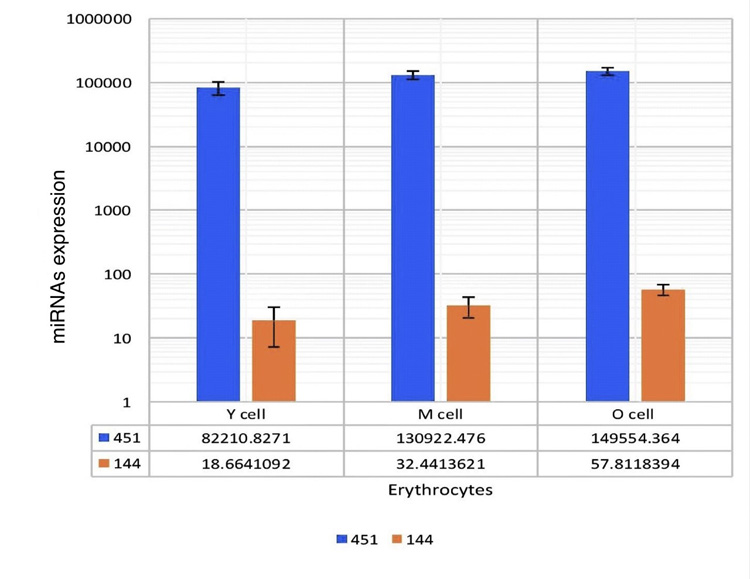
MiRNA-451 expression was 82210.8271, 130922.476, and 149554.364 in y, m, and o cells, respectively. MiRNA-144 expression in y cells was 18.6641092, m cells was 32.4413621, and o cells was 57.8118394 These results showed that o cells expressed both miRNA-144 and miRNA-451 more than that of m, and y cells.
Conclusion:
The findings of this study showed that miRNAs expression differ in sub-fractionated erythrocytes. This study suggests that miRNA-144 and miRNA-451 have the potential to be used as biomarkers of RBC aging.
1. INTRODUCTION
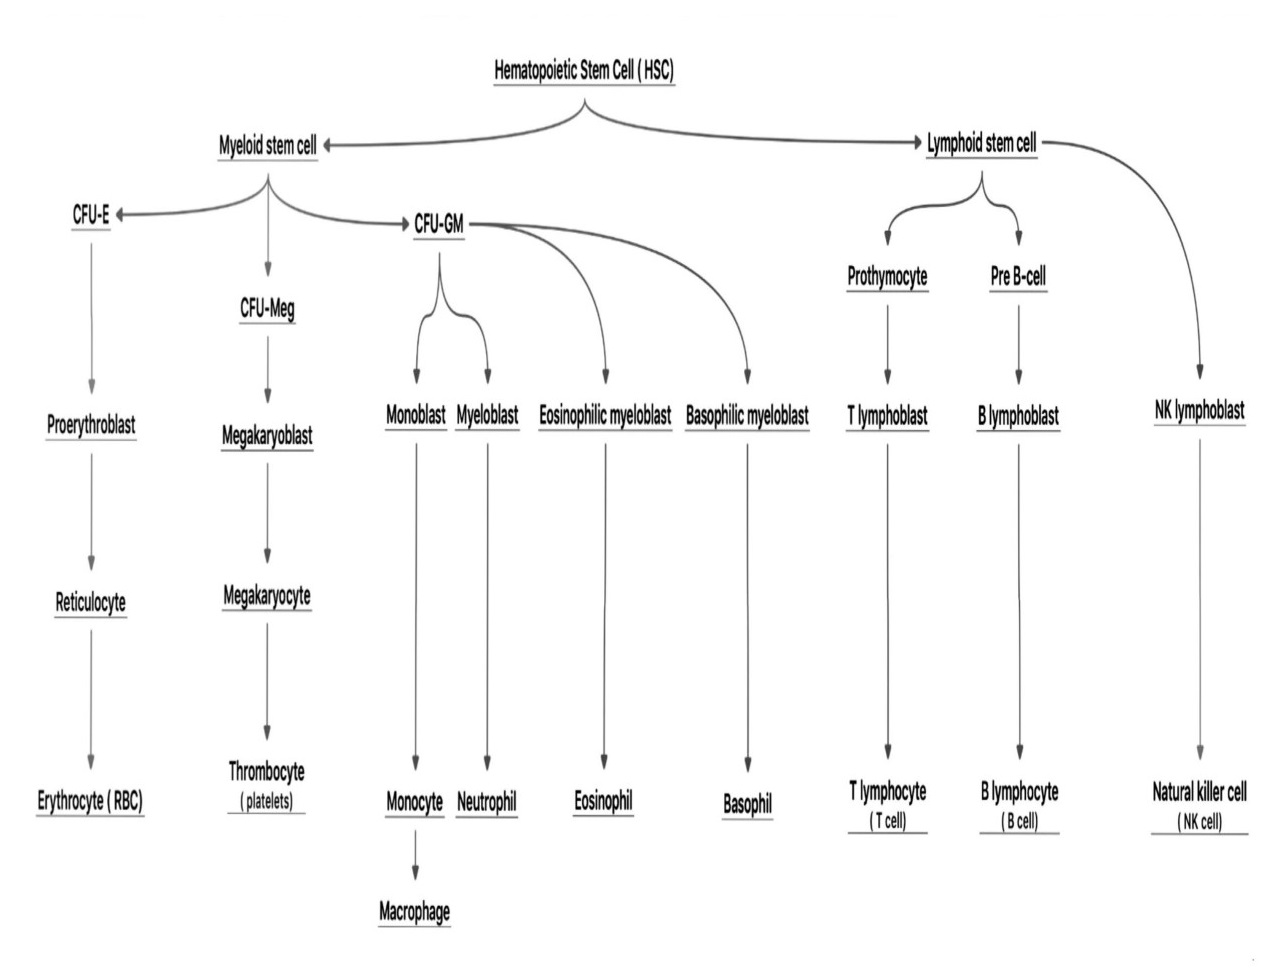
Red Blood Cells [RBCs] are considered to be the most abundant cells in circulation. About 2 million RBCs are produced per second and released into the blood stream in a steady state condition [1]. The first lineage of RBCs production is the erythroid. Proliferation is one of the important stages that help the precursor cells to amplify into huge number of cells that will differentiate to the final cell types [2]. Erythroblasts differentiate to erythrocytes (E) after going through numerous changes, such as cells hemoglobinization, nuclear condensation and enucleation. The process of RBCs synthesis is called erythropoiesis that must be effective and robust in order to regulate body homeostasis [3]. The whole process of erythrocyte formation is outlined in Fig. 1.
2. MIRNAS AND RED BLOOD CELL AGING
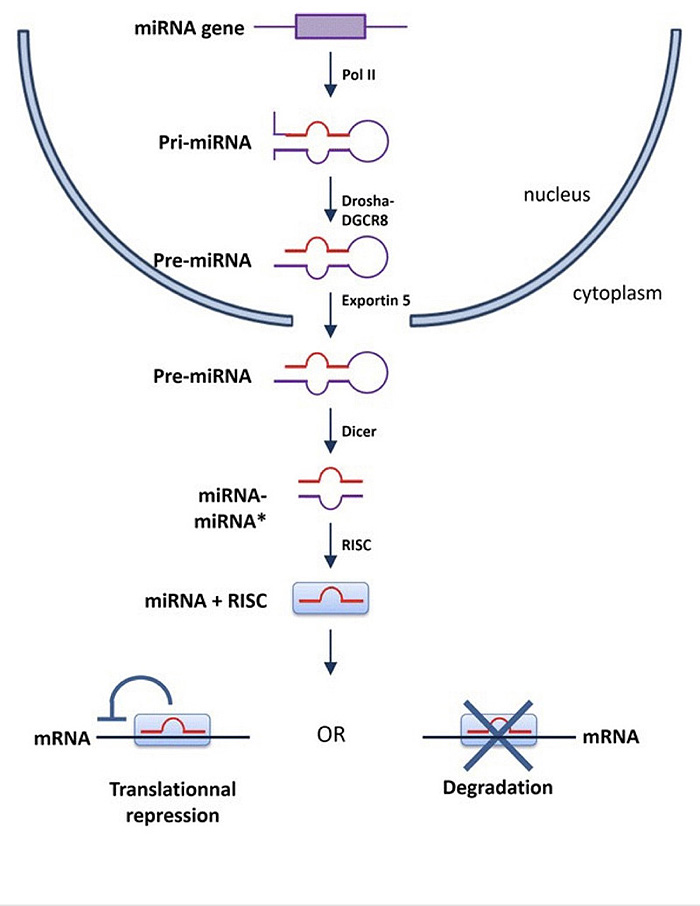
MicroRNA [miRNA] is a type of non-coding RNA that contains small 19-23 nucleotides that is important in regulation of gene expression by binding to specific mRNA to alter the expression of the targeted message. Changes in miRNA binding site nucleotide will lead to falsely binding to mRNA and increase the gene expression that leads to increase the gene product [4]. MiRNA-144 and miRNA-451 are found to be highly expressed in RBCs specifically in erythroblasts. Both miRNA-144 and miRNA-451 are important for the proliferation and differentiation of erythrocytes [5].
MiRNA-144 and miRNA-451 are highly expressed in erythroblasts and their coding gene is located in chromosome 11 [7]. MiRNA-144 and miRNA-451 were found to be in several species other than humans, such as mice and zebrafish. These miRNAs [miRNA-144 and miRNA 451] are required for terminal erythropoiesis in all previous species [8-10]. One of the studies deleted miRNA-144 and miRNA-451 to determine the significance of these two miRNAs in erythropoiesis. The results revealed that loss of miRNA-144 and miRNA-451 caused mild anemia and reticulocytosis with moderate abnormalities in erythrocyte morphology [11]. MiRNA-451 functions, as studied in zebrafish embryos, reportedly functions to maintain late-stage erythrocytes maturation [12] (Fig. 2).
3. MATERIAL AND METHOD
3.1. Ethical Statement
This study was carried out in accordance with the guidelines of the Howard University Institutional Review Board (HUIRB). The protocol was approved by HUIRB (IRB-13-MED-73). All participants of this study gave writing informed consent.
3.2. Subjects
Study participants were recruited from the Howard University Hospital Community. All samples were collected from the self-declared healthy individuals. Individuals who were pregnant, possessing malignant tumors, and smokers were excluded from this study. Whole venous blood was collected in heparinized vacutainer tubes following a period of fasting 8-12 hours. Each blood sample was centrifuged for 20 minutes at 1200 rpm to remove plasma within 2 hours after collection.
3.3. Isolation and Purification of erythrocytes
Boyum method as described by Gambhir et al. [13] was used to isolate erythrocytes. The erythrocyte pellet was purified by adding isotonic choline chloride solution (2x the volume of erythrocyte) and mixed by inversion. The erythrocyte suspension was layered on the tube (12 x 25 mm) containing a mixture of 1 ml Hypaque (H) (33.9%) and 2.4 mL Ficoll (F)(9%) (H-F mixture) and then spun at 1200 rpm for 20 minutes at room temperature. This procedure was repeated twice.
Separation of RBCs according to their age as y, m, and o was performed as described by Gambhir et al. [14]. The purified erythrocyte age sub-fractions were obtained by the differences in the specific densities of RBCs.
To create a distinctive layer of percoll gradient, 8 tubes were labeled 1 to 8, with tubes containing 1.3 mL medium and 0.7 mL percoll, 1.2 mL medium and 0.8 mL percoll, 1.1 mL medium and 0.9 mL percoll, 1.0 mL medium and 1.0 mL percoll, 0.9mL medium and 1.1 mL percoll, 0.7mL medium and 1.3mL percoll, 0.4mL medium and 1.6mL percoll and 1mL percoll, respectively. To the test tube 8 containing only percoll, dilutions from tube 7 to 1 were layered to stratify a discontinuous gradient containing 35%, 40%, 45%, 50%, 55%, 65%, 80% and 100% percoll. The purified erythrocyte pellet was layered to the wall of tube 8 (containing the discontinuous gradient) and then spun at 1200 rpm for 30 minutes. The three sub-fractions of percoll density were identified 1.08-1.09 as y, 1.09-1. 11 as m and 1.1 1-1.12 as o as described in (Fig. 3).
3.4. RNA Isolation
To isolate total RNA from the age sub-fraction RBC, the commercially available kit, mirVana miRNA Isolation kit (Invitrogen; Thermo Fisher Scientific, Inc.), was used following the protocol outlined by the manufacturer. Briefly, 400 µL age fractionated RBC sample was disrupted by adding 400 µL of lysis/binding buffer. Then 1/10 volume (80 µL) of miRNA Homogenate Additive was added to the age fractionated RBC sample and vortex. The samples were incubated 10 min on ice. Extracted with a volume of Acid-Phenol: Chloroform equal to the initial lysate volume (800 µL) and centrifuged at 10000 rpm for 5 min. The aqueous phase after centrifugation was recovered by transferring it to a fresh tube. Absolute ethanol was added to the lysed age fractionated RBC sample. Seven hundred µL of this sample was transferred to the fresh filter cartilage, then centrifuged for 15 seconds and discarded the supernatant. Seven hundred µL of wash 1 was added to the filter and centrifuged for 15 seconds. Five hundred uL of wash 2/3 was added and centrifuged for 15 seconds then discarded, and the supernatant saved and filtered. The wash 2/3 procedure was repeated twice. Eluted RNA with 100 µL 95°C Elution Solution or Nuclease-free Water in a new tube and spun for 20-30 seconds to recover the RNA. NanoDrop (ND-One) spectrophotometer (Thermo Scientific, Inc) was used to determine concentration and purification of RNAs.
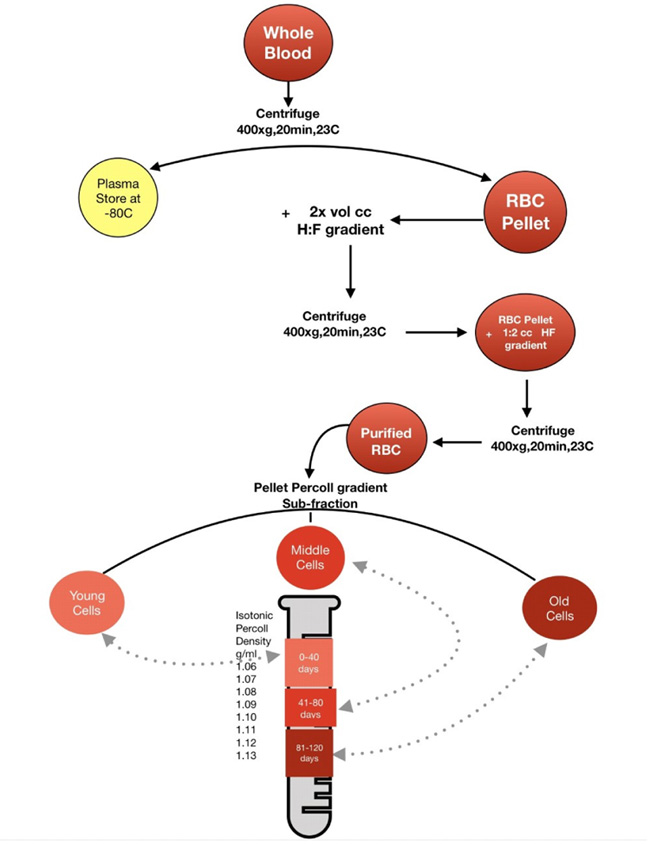
H:F Hypaque- ficoll gradient ( Boyum gradient ) CC: Choline Chloride.
| Red Blood Cell subfraction | miR-451 expression | miR-451 relative expression | miR-144 expression | miR-144 relative expression |
|---|---|---|---|---|
| Young Age cell (y) | 82210.8271 | 1 | 18.6641092 | 1 |
| Middle Age cell (m) | 130922.476 | 1.59 | 32.4413621 | 1.74 |
| Old Age cell (o) | 149554.364 | 1.8 | 57.8118394 | 3.1 |
3.5. RT-qPCR
For each sample, 50 ng of total RNA containing miRNA was reverse transcribed into cDNA using the MicroRNA Reverse Transcription kit (AB Applied Biosystem) according to the manufacturer's protocol. The resulting cDNA served as a template for miRNA qPCR analysis (AB Applied Biosystem, Inc.). The amplification profile was on hold at 50°C for 2 minutes and at 95°C for 20 seconds followed by 40 cycles of 95°C for 1 second and 60°C for 20 seconds.
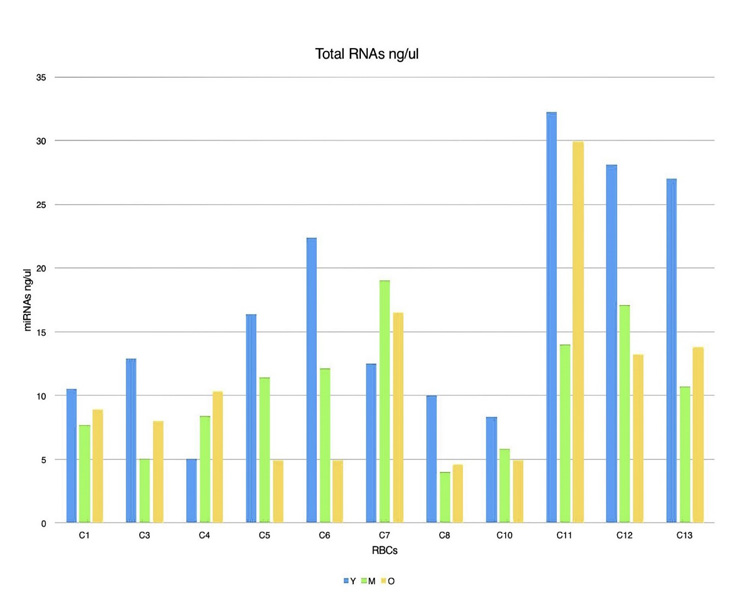
4. RESULTS
This study aimed to utilize miRNA-144 and miRNA-451 as biomarkers for cell aging in AAA. In screening for different miRNAs expressions in age fractionated erythrocyte, we performed total RNA isolation from y (0-40 days), m (41-80 days), and o (81-120 days) that revealed different amounts of RNA in each of the different cell age fractions (Fig. 4). We selected two miRNAs with the highest expression levels (miRNA-144 and miRNA-451) in RBCs. For miRNA-144 and miRNA-451 quantification, we used RT-qPCR Taqman probes which allow the detection of PCR products by generating a fluorescent signal. U6 was used as a control. The results of these PCR products are shown in (Table 1). miRNA-451 expression were 82210.8271, 130922.476, and 149554.364 in y, m, and o cells respectively. MiRNA-144 expression in y cells was 18.6641092, m cells was 32.4413621, and o cells was 57.8118394. To get relative quantification, we used y cells as the reference sample in order to analyze gene expression changes in sub-fractionated erythrocytes. To calculate the relative expression of each miRNA (with respect of y cell miRNAs expressions), we divided m and o cells miRNA expressions by miRNA expression in the y cells. For instance, we had 130922.476 and 82210.8271 as miRNA-451 expressions in m and y cells, respectively. We got 1.59 which is miRNA-451 relative expression by dividing 130922.476/ 82210.8271.
When these miR-451/144 expressions of fractionated erythrocytes were compared, the O RBCs demonstrate more miRNA-144 and miRNA-451 expression than m and y RBCs. There were significant differences observed in the expressions of these two miRNAs in y, m, and o cells. These values were expressed as 1:1.74:3.1 and 1:1.6:1.82 in y, m, and o, respectively (p<0.05). Moreover, miRNA 144 is relatively less expressed than miRNA-451 Fig. (5).
The miRNA 144 and miRNA-451 are involved in the process of erythropoiesis and may also be participated as a marker for cell aging.
5. DISCUSSION
MiRNAs play an important role in cellular differentiation, apoptosis, and aging [15]. Circulating blood microRNAs can be considered as health and disorders biomarkers [16]. Our observation showed that among these
RBCs miRNAs, we identified miRNA-144 and miRNA-451 as potential novel biomarkers of human RBC aging in AAA. We report, for the first time, the expression of miRNA-144 and miRNA-451 in sub-fraction RBCs are different. The ratio of miRNA-144 and miRN- 451 were expressed as 1:1.74:3.1 and 1:1.6:1.82 in y, m, and o respectively. As described in the Results section, these relative ratios are with respect to y cells. The deletion of miRNA 144 and miRNA 451 the most expressed erythroid miRNA gene, causes anemia and increased RBC to oxidant stress. The miRNA 144 and miRNA 451 expressions were highly up-regulated in o RBC than in y and m. The main objective of this study was to develop a simple and efficient method suitable for studying miRNA-144 and miRNA-451 as red blood cell aging biomarkers. Cell aging, known as cellular senescence, is a process of irreversible growth arrest that stops any damaged cells from growing. The role of cellular senescence is to protect cells against cancer; however, recent studies added more complex roles, such as cellular development, tissue repair, and age related disorders [17]. Chronic conditions, such as heart disease, diabetes, and cancers that are known to affect the whole organism function have many risk factors, such as aging. There is increasing evidence that chronic age-related diseases incidence will increase as the world’s population ages >60 years will double in the next four decades. In the United States, health disparities are linked to race. One study suggested that black individuals are aging faster than whites individuals [18]. Therefore, there is a need to investigate molecular biomarkers, such as miRNAs for early detection of cell aging in AAA. The purpose of this investigation was to determine whether miRNA-144 and miRNA-451 can be used as a possible marker of cell aging in AAA. Real time PCR of miRNA-144 and miRNA-451 was conducted, and the results showed that the expression profiles of RBC miRNA-144 and miRNA-451 of AAA individuals were different in different RBC sub-fractions. The results of real-time PCR indicated that RBC miRNA-144 and miRNA-451 expression levels were significantly increased in o cells compared with the m and y cells. Interestingly, the levels of miRNA 451 were also significantly higher in all cell sub-fractions than miRNA 144. The expression trend of both miRNAs provides direct evidence for the relationship between RBC miRNAs and cell aging. Many studies indicate that miRNA-144 plays a crucial role in the process of erythropoiesis as an erythroid-specific regulator [19]. Moreover, biological experiments showed that miRN-144 can increase the RBC number by inhibiting RAB14 transcription [20]. Therefore, it is possible that RBC-derived miRNA-144 influences the process of erythropoiesis by targeting RAB14. Papapetrou et al. observed that the expression level of miRNA-144 increases during erythropoiesis in HSCs and miRNA-144 can positively regulate erythrocyte differentiation [21]. Therefore, we speculate that miRNA-144 derived from erythrocyte vesicles may be taken up by the HSCs and inhibit the expression levels of target genes (e.g., RAB14), resulting in the promotion of erythropoiesis.
On the other hand, the target gene of miRNA-451 is not well determined. Experiments using Zebra fishes showed knockout of miRNA-451 induced severe reduction of RBC production, suggesting that miRNA 451 is one of the key molecules for erythropoiesis. One study suggested that miRN- 451-Ago2 complexes in mature RBCs may be playing roles for homeostasis of normal erythropoiesis, and the analysis of miRNAs-Ago2 complex in RBCs is relevant for understanding normal and pathological erythropoiesis [22].
CONCLUSION
These results are consistent with our hypothesis that miRNA-144 and miRNA-451 may be used as useful biomarkers of RBC aging. From these results, one also could speculate that circulating non-nucleated cells have evolved to require alternative means of regulating protein translation to maintain viability during 120 days (RBC) life span.
MiRNA expression differences in human HSC lineages enable regulated transgene expression [23]. However, further studies are needed to fully understand the role of these miRNAs as RBC aging biomarkers.
ETHICS APPROVAL AND CONSENT TO PARTICIPATE
This study was approved by Howard University Institutional Review Board (HUIRB) (IRB-13-MED-73) USA.
HUMAN AND ANIMAL RIGHTS
No animals were used in this research. All human research procedures were followed in accordance with the ethical standards of the committee responsible for human experimentation (institutional and national), and with the Helsinki Declaration of 1975, as revised in 2013.
CONSENT FOR PUBLICATION
Written consent was obtained from each participant.
AVAILABILITY OF DATA AND MATERIALS
Not applicable.
FUNDING
This work was partially supported by the JHU-UMD DRC Grant P30DK079637-08, Grant # 4525 and the NIH Research Grant 5G12MD007597 ( Dr. Gambhir, PI).
CONFLICT OF INTEREST
The authors declare no conflict of interest, financial or otherwise.
ACKNOWLEDGEMENTS
Authors thank fellows, clinicians and staff DTC for their kind cooperation in getting the blood drawn of the subjects. The authors would also like to thank Dr. Maurice Fluitt for his diligent proofreading of this paper.