All published articles of this journal are available on ScienceDirect.

Available Instruments for Analyzing Molecular Dynamics Trajectories
Abstract
Molecular dynamics trajectories are the result of molecular dynamics simulations. Trajectories are sequential snapshots of simulated molecular system which represents atomic coordinates at specific time periods. Based on the definition, in a text format trajectory files are characterized by their simplicity and uselessness. To obtain information from such files, special programs and information processing techniques are applied: from molecular dynamics animation to finding characteristics along the trajectory (versus time). In this review, we describe different programs for processing molecular dynamics trajectories. The performance of these programs, usefulness for analyses of molecular dynamics trajectories, strong and weak aspects are discussed.
INTRODUCTION
The rapid development of computing technology, especially in the last 10 years, has led to an explosion of publications in physics, chemistry, biology, and interdisciplinary sciences, where researches obtain new results with the help of the so-called computer simulation (or “in silico” experiment). Term computer simulation usually applicable when a computer is involved in research as a solver of a complex mathematical models representing real world processes, experimental study of which is too difficult (i.e. takes too much time, money etc). The technical progress in Information technology (IT) has resulted in the development of a variety of new numerical algorithms and approaches for solving different problems with the use of computers. This process multiplied by overall progress in hardware development made computer simulation to be one of the commonly used tools for studying properties of different molecular systems and objects along with traditional theoretical (analytical) approaches as well as experimental methods.
MOLECULAR DYNAMICS AND ANALYSIS OF MD TRAJECTORIES
The knowledge of three-dimentional (3D) protein structures is vitally important for rational drug design. There are two main experimental approaches for solving protein 3D structure: X-ray and NMR. Both methods have their own benefits and what is more important limitations. Although X-ray crystallography is a method by which most of the known protein structures were obtained not all proteins or protein complexes can be crystallized. Membrane proteins are example of such limitation due to difficulties in crystallization since most of such proteins will not dissolve in normal solvents. NMR on the other hand suits well for solving the 3D structures of membrane proteins (see, e.g., [1-6]), but it is costly and suits only for the medium-sized proteins. Therefore, very few membrane protein structures have been determined. Helping hand in difficult cases like solving 3D structure of membrane proteins came from the computer modeling where one with the help of special software can construct a protein model on the basis of homological proteins and watch the dynamic behavior of the modeled system. Such approach was found to be reasonable (see, e.g., [7-10]) and a comprehensive review [11]) in drug development. In this review the various approaches for analysis of Molecular Dynamics (MD) trajectories are considered.
Nowadays the method of molecular dynamics became almost mandatory part of theoretical analysis of molecular structures.
Several programs are available for numerical calculations with the MD method, including GROMACS (GROMOS) [12, 13], HyperChem [14, 15], CHARMM (CHARMm) [16], NAMD [17-22], and PUMA [23, 24]. Modern programs do cover all the computer classes: personal computers (single-processor and low-power processing calculations), supercomputers (multiprocessor complexes), and calculations accelerated by GPU (massive parallelism algorithms for NVIDIA CUDA [25]).
All the previously mentioned programs use a Protein Data Bank (PDB) file as the input since it contains information on the 3D structure of the molecular complex. The information on the modeled object can be modified within the program, for example, by adding a solvent (water molecules) or other molecules. Also PDB data itself (atom coordinates) are not enough for molecular dynamic simulation and it needs to be prepared. Simulation programs do compile lists of constantly interacting particles (using the preset force field) and define initial velocities of atoms in accordance with the initial temperature. When preparations are finished simulation can be launched.
The process of simulation of MD is the process of integration of Newton's second law of motion equations. Coordinates of atoms and appropriate values are estimated through fixed time step, an integration step. The outputs of the MD simulations are trajectories representing snapshots of evolution of the system and appropriate values of time, energy (for example van-der-Waals), applied force, temperature of the system etc.
MOLECULAR DYNAMICS ANALYSIS
When the time consuming MD simulation is done, the MD analysis program can work fast with the results of the simulation – trajectories of molecular dynamics.
The main purpose of MD simulation is the resultant trajectory of evolution of a studied system. MD simulations can take a lot of time (weeks, months) and thus produce huge amount of data which is then needed to be analyzed. So one can formulate requirements to the MD analysis program:
- qualitative visualization of evolution of studied system;
- fast processing of huge volumes of data;
- different analysis options.
Additional parameters may vary depending on the researcher purposes but all of them depend on the geometry of atomic coordinates. Contact map is the useful characteristic for the studying polymers. Thus, Trajectory Analyzer of Molecular Dynamics (TAMD) allows user to trace evolution of contact map as function of time.
Visualization of evolution of studied system implies using hardware graphics accelerators with the OpenGL or DirectX technology.
Trajectory files can contain a huge amount of frames with data for large macromolecules. Such cases are a difficult task for the program developers since program performance can drop significant. To overcome such situations, some programs copy all trajectory files to the memory. This is very effective for processing, but is not a solution when the file size is comparable to the RAM volume or higher. Some programs, TAMD for example, use a buffer of random access to trajectory files. Approach which scales program performance adequately and is safe when trajectory files are too large.
HARDWARE BACKGROUND
Crucial part which made computer simulations possible is the rapid development of computers hardware. Greatest impact on trajectory analysis software was caused by two reasons. On the one hand, the capacity of the existing storage devices made running of long simulations resulting in gigabytes of data possible. On the other hand, new rendering engines using latest video chipsets made visualization of evolution of a molecular system very informative and convenient for analysis. As concerns the era of popular personal computers, a special contribution to the development of the means of visual analysis of trajectories was made with the advent of individual graphics adapters. In 1981 the IBM Corporation produced the CGA (Color Graphics Adapter) card and also the first array for color displays. In 1987 subsequent to several intermediate models (EGA and MCGA) the same corporation produced a graphics adapter and a similar VGA (Video Graphics Array) that has remained useful almost thirty years later. At intermittent rating of 640480 pixels in the horizontal and vertical directions, respectively, such video graphics arrays are able to display images with a frequency of 60 Hz. This VGA supports 256 colors, each of which can have one of 262144 different magnitudes (6 bits are allotted for the red, green and blue components), the VGA memory being 256 kB. The VGA allows for a reliable image of the dynamics of molecular graphics representation. The next array (SVGA or SuperVGA) was produced in 1991 and is used currently. The producers increased the number of colors to 16 and the resolution to 24 bits, which permitted supporting any frequency of data output. The latter grew persistently in the epoch of CRT displays and dropped drastically to 60-75 Hz with the emergence of LCD displays.
The next step in the development of graphics adapters was the 3D accelerator which is explained first of all by computer games rather than by research needs. At the beginning of the 1990s, the company 3dfx Interactive proposed to use Glide – API for 3D graphics which was based on their own Voodoo Graphics arrays. The images have not become more realistic (they could be estimated with the central processor), but the SVGA was ample. Due to 3D accelerators the process of imaging became fast as a result of which it was possible to rapidly change images creating the effect of animation. Then the generations of graphics adapters can be divided among DirectX and OpenGL versions supported by them and up-to-date API versions actively developed nowadays.
PROCEDURE OF MD CALCULATIONS
In general purpose of MD simulations can be divided into two types according to the researcher needs: (1) analysis of single structures (for example, structures from the Protein Data Bank (pdb files)) and (2) studies of dynamic properties (from molecular dynamics simulations). Term “dynamic property” is used here as a synonym of characteristic along the trajectory or function of time. One should keep in mind that due to large number of parameters and, in general, time-consuming process of simulation focal point of research should be formulated before simulation preparations.
Mostly MD is used to study dynamical behavior of considered system. Before running MD simulation a molecular system should be designed (adding solvent into system, adding and configuring ligands etc.). After studied system is prepared one should properly set up initial conditions and only then a MD simulation should be performed.
To the date there are several different software packages exists for running MD. The choice of a package depends on a goal of study and the available resources. We will review several MD packages in the following sections.
ANALYSIS OF RESULTS OF MD SIMULATIONS AND DATA PROCESSING
Ideal software for analysis of MD trajectories must support visualization of trajectories or the so-called molecular animation. Also such software should support hardware acceleration for visualization since rendering of complex scenes may be resource greedy. Another obvious option that should be available for a user is the possibility to orient macromolecules in the 3D space.
In addition to animation of the heat motion of molecular systems, programs for analysis of MD trajectories have a collection of additional functions. The latter varies depending on the makers and cannot be strictly classified. On the one hand, the part of MD simulation packages already contains some tools for analysis of trajectory. On the other hand, a description of the complete set of programs is required for better orientation in analyzing trajectories.
VMD
VMD (Visual Molecular Dynamics) is a product of the Group of Theoretical Biophysics from the University of Illinois [26-31]. It was developed specially for visualization and analysis of such biological systems as proteins, nucleic acids, and molecular systems on the basis of lipids (for example, components of cell membranes). The program compatible with the PDB format and allows user to use various methods of visualization and coloring molecules. VMD is suitable for animation and analysis of phase trajectories obtained from MD simulation. An attractive peculiarity of the program is that it can be used as a graphics computer system for modeling and can operate on a remote computer. It is integrated with NAMD.
VMD supports a great number of formats of files for biomolecules, able to process huge amount of data and has broad possibilities for visualization and rendering of images and animation [32].
Below is the list of additional functions of one of the most known systems for visualization and analysis of molecules as it is positioned by the authors, a team from the University of Illinois and the Beckman Research Institute.
- Visualization and analysis of molecules.
- Fast choice of atoms and amino acid residues.
- Comparison of two structures.
- Support of user’s action recording in the scripts.
- Support of the Raster3D format (raster format for obtaining high-quality images).
- Generating Ramachandran plots.
- Support of a variety of types of molecular images.
- Stereoscopic output.
- Command line support.
- Working with arrays and vectors.
- Support of JavaScript.
CMView
Contact maps are a useful approach of representation of structural data helping researcher in determination of structural properties such as domain architecture, secondary structure and contacts between clusters. CMView [33, 34] combines rich possibilities of contact maps analysis with 3D visualization using PyMol. It provides functions for calculation of a contact map from the 3D structure, basic editing, 3D visualization and structural comparison with different methods of alignment. A unique feature of CMView is an interactive refinement of structural alignment based on substructures chosen by the user.
WhatIF Project
This project is developed by a team of researchers under the lead by Prof. Gert Vriend from the Centre for Molecular and Biomolecular Informatics (CMB) [35]. The project was founded in the University of Groningen in 1989. It is positioned by the authors not only as a computer program, but also as a system of viewpoints because scientists from many countries have contributed to its development. In addition to the program itself (it is of free access for academic users) there are also a number of web-servers processing the molecular data. As a rule, they request input data and send back the result in a time depending on the server loading.
The WhatIf modules are designed for molecular modeling, construction and processing of the obtained data. The basic possibilities of the available program servers are:
- Analysis of tertiary and quaternary protein structures.
- Verification of protein structures upon loading to the PDB.
- Correction of protein structures.
- Visualization of macromolecules and their interactions with water, ions and lipids.
- Interactive editing of macromolecules.
- Analysis of proteins:
- Recognition of secondary structures;
- Estimation of torsion angles;
- Analysis of interatomic contacts;
- Contacts with DNA and RNA;
- Analysis of connections.
- Two-dimensional graphics:
- Plotting of B-factor;
- Generation of Ramachandran plots.
- Three-dimensional graphics:
- Generation of hydrogen bonds;
- Coloring according to B factor.
- Analysis of hydrogen bonds:
- Compiling a list of hydrogen bonds with DNA/RNA;
- Addition of missing protons to the structure.
- Analysis of interatomic contacts:
- Verification of the distance between the atoms;
- Contact maps;
- Contacts of C-alpha and C-beta atoms.
- Rearrangement of coordinates relative to the center of mass.
- Cysteine analysis.
- Analysis of water molecules:
- Compiling a list of water molecules interacting with protein.
- List of ions in pdb file.
- Analysis of symmetric structures.
As seen from the above list, the program servers are commonly aimed at making analyses of static structures. Most part of the described programs gets a pdb file upon their loading.
The participants of the project performed several studies using the designed programs [36-39]. The study of 1999 [40] is of special interest, it describes the program for loading a stereo image to the display although at that time advanced means for loading three-dimensional graphics data just appeared.
QuteMol
This is a program with an open source code for interactive visualization of molecular systems [41]. QuteMol makes use of the available possibilities of current computer graphics including the OpenGL library. The program has a wide number of graphical effects. Visualization methods of QuteMol are aimed at improving data representation and facilitating visual perception of the 3D form and structure of large molecules.
The program is also suitable for simple and quick visualization of pdb files.
MoDyp
This software package with an interactive interface was developed by the Molecular Dynamics Group (Moscow
State University) for MD simulation of the motility of molecular systems using various force field parameters. The kernel component of MoDyp is used as the basis for the program of distributed computing of the MD@home project [42].
TAMD
This program is a basis for derivation of uncommon characteristics along MD trajectories, which other software lacks due to whatever reason. As a consequence, on the one hand we get a possibility of an easy and fast realization of mathematical algorithms. On the other hand, we can study in detail the behavior of the characteristics dependent on the initial data and parameters, making general conclusions on the processes occurring in chemical and biological systems [43].
Possibilities of TAMD
- 3D molecular animation of large molecular objects (100 000 atoms) with superstructuring of the output information.
- Work with substructures.
- Calculation of characteristics along the trajectory based on the geometry of system.
- The tools for working with function plots including their statistic processing.
- Calculation of the coefficient of variation of MD.
- Visualizing quasi-harmonic oscillations.
- Interactive plotting of expanded dynamic contact maps for large molecular objects with the supporting CUDA technology.
- Working with extended MD trajectories.
- The tools for trajectories repairing (damaged as a result of system errors)
- The tools for making reports on errors.
- Realization of source algorithms of three types: for one processor, for a multiprocessor system, and for parallel array computers (CUDA).
- Script supporting for routine operations automation.
Distributed Computing Projects
The aim of the project Folding@home [44] is to obtain a more accurate pattern of the pathogenesis of diseases caused by misfolding of proteins. The project allows studying proteins associated with Alzheimer’s and Parkinson’s diseases, type II diabetes, mad-cow disease and sclerosis. If the reason for misfolding of proteins of one type is disclosed, it will allow the researchers to understand why this occurs with other proteins as well.
The client-server consists of two parts: the shell and the computational kernel.
Most of the computational kernels (GROMACS, DGROMACS) are optimized for extended instructions – SSE, 3DNow!, SSE2, and SSE3.
The calculation programs are available at the following source software.
- Windows 98/ME/2000/XP/2003/Vista/2008:
- for single processors (the HT technology included);
- for multi-core processors (SMP);
- for graphics processors with the ATI adapter.
- Linux (for console only):
- for single processors (the HT technology included);
- for multi-core processors (SMP).
- Macintosh Mac OS X 10.3+/10.4+:
- for multi-core Intel processors (Core2Duo/Core2Quad/Xeon);
- for PPC processors (G3/G4/G5).
- Playstation 3.
DockSearch
An original DockSearch program [45, 46] for modeling and design has been developed at the Institute of Biomedical Chemistry (Moscow). This program permits realizing procedures of geometrical docking of two molecules and operates with a database of 3D structures of small molecules (low molecular organic compounds).
SPARTAN
This is a program product [47, 48] for molecular modeling produced by the Wavefunction, Inc [49]. There are SPARTAN versions both for working stations and for personal computers with separate computing modules available in versions for supercomputers (Fujitsu and Cray). Analogous to MoDyp, SPARTAN has an interface for calculations in distributed networks. Molecular mechanics and quantum chemistry methods are among opportunities provided by SPARTAN. Properties calculated with the use of the program package include enthalpy, entropy, free energy, dipole moments, etc. An up-to-date graphics interface has been designed for SPARTAN as well as an opportunity to exchange data with other known programs.
In contrast to SPARTAN, TAMD is distributed as a completely free program with an open access program package [43].
Alchemy 2000
This is a package [50] for molecular modeling and visualization for personal computers produced by GGA Software Services [15]. The program has an intuitively clear graphical interface, powerful tools for visualization of structure of studied system and might be used for calculation of energy parameters, search of structural conformations and might be used for running MD simulations. Alchemy 2000 operates not only with protein molecules but with other molecular objects such as polymers and small molecules.
NAMD
This package of programs [17-22] was developed by the Group of Theoretical Biophysics from the University of Illinois in cooperation with the Beckman Research Institute and is designed for high-performance parallel MD modeling. Unlike SPARTAN and Alchemy 2000, NAMD is distributed free of charge. Users are provided with the source code, documentation and a set of compiled binary files for different parallel source software for calculations. NAMD supports the massively parallel CUDA technology [25, 51].
GROMACS
This is an extremely all-around software for simulation of the dynamics of large molecular systems (from thousands to millions of particles) [12, 13]. It was developed by the team of Prof. Herman Berendsen from the Department of Biophysical Chemistry (University of Groningen), and at present GROMACS is being developed further and supported by enthusiasts from different countries. The package is designed for modeling biomolecules (proteins and lipids) with a large number of interacting atoms, but it also provides a high rate of calculations for non-associated interactions. It is believed that GROMACS is one of the fastest tools [52-54]. It operates on the basis of Linux and is distributed free of charge.
Due to its attractiveness, GROMACS has a large amount of additional software tools for designing molecular systems [55] and for simplifying the programming [56-58].
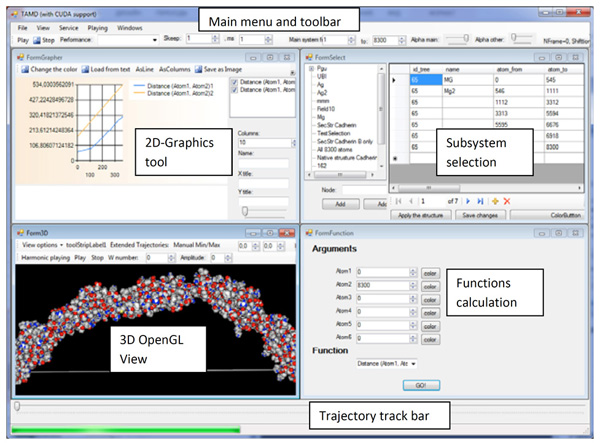
Typical view of a trajectory analyzer. Top-left: tool for working with charts. Bottom-left: 3D molecular cinema. Top-right: tool for subsystem selection. Bottom-right: functions for analysis of trajectories.
HyperChem
The description of programming tools for molecular modeling should be finished with mentioning of HyperChem [14, 15]. It is an attractive commercial programming product (with a 30-day trial period) manufactured by the Hypercube Company [59] and represents a set of tools which use approaches from molecular mechanics, quantum chemistry and molecular dynamics to study different molecular systems. The popularity of this software is explained first of all by a detailed documentation supported by examples that makes this package perfect for studying the principles and practical approaches to molecular modeling [60].
However program is rather slow because of absence of multiprocessor support.
The most productive way to use this tool is to use it as an interactive molecular designer. In this context the use of HyperChem for MD plays a secondary role, for example, for minimization of the obtained structure.
In conclusion one can say that universal programs of the “all-in-one” type, such as GROMACS and HyperChem, are successful mainly because of several of their components which are highly demanded. Thus HyperChem can be used to run MD simulation following its visualization, but speed is out of the question. In the case of GROMACS MD calculations are in the first place. Besides it contains a number of tools for analyzing the results. But management of the program is carried out in the command text mode, which makes GROMACS to have a high barrier to entry.
Place of TAMD Among Other Programs
TAMD is a program for analysis of trajectory solely (see Fig. 1). To run simulations it is required to launch some other external program able to do MD simulations. At the moment PUMA has been chosen for MD modeling [23, 24]. Occasionally it is also required to use other programs (for example HyperChem) for preparing MD structure.
In contrast to CMView, the TAMD program is designed mainly to analyze MD trajectories. TAMD provides an adjustable output of molecular animation (without running external programs such as PyMol [61]) with a simultaneous rendering of a contact map in dynamics along the trajectory with mapping the user’s data.
Unlike WhatIf, TAMD is represented as an interactive program for processing MD trajectories with personal computers having an ability of package processing of the data.
Because of the requirement to estimate the contact map in dynamics in real time, TAMD uses parallelization concept (the CUDA technology [25]) of the NVIDIA Corporation [51]. The technology renders contact maps with a frequency of several dozens of images per second (for contact maps containing several thousand atoms). It would be incorrect to give more accurate estimate since the rendering rate depends on model of the CPU and GPU as well as on the bus bandwidth used for data transmission.
VMD is a program for analysis of MD trajectories but also it can operate with pdb files. The performance of VMD is higher than that of TAMD with regard to 3D visualization of large systems. VMD has a variety of complex algorithms for analysis of trajectories. TAMD contains numerous algorithms available in an interactive mode for analysis of 3D protein structures on the base of system geometry. VMD downloads the whole trajectories with different formats to the operation memory while TAMD puts forward a random access buffer to the trajectory.
In addition, TAMD is aimed at analysis of the dynamics of macromolecule system. Sophisticated characteristics existing in other programs (such as contact maps) are also implemented in other software products. Moreover, the algorithm of their operation can be easily described having minimum knowledge on any programming language. The unique attribute of TAMD is that it provides dynamic interactive operations with complex characteristics.
In this case the word “dynamic” is used as a synonym of “characteristic along the trajectory or function of time”. Interactivity is a property of programs to rapidly respond to the user’s requirement. As concerns TAMD, it is an opportunity to easily rearrange characteristics depending on the input parameters.
Let us focus our attention of the client-server architecture of the program. TAMD is not a program of molecular dynamics modeling that requires vast calculation resources during the long time. Nonetheless, the client-server mode can be organized as a TAMD client and SQL server (for example, MySQL or Microsoft SQL Server), which would be responsible for data storage.
In spite of the accuracy of a standard approach, it is noted that in the process of working with the research system there appear additional problems that could not be expected before the performance of base experiments, i.e. numerical experiments. The “problem-study-resolution” is substituted by the “problem-study-{question-study}-resolution”. It was just for an opportunity to pose problems and solve them directly in the course of the study itself that a class of programs for analysis of MD trajectories was developed. Moreover, a present-day researcher requires a complete program set for a fast interactive analysis of molecular data. The latter is satisfied by the TAMD program.
CONFLICT OF INTEREST
The authors confirm that this article content has no conflict of interest.
ACKNOWLEDGEMENTS
We are grateful to T.B. Kuvshinkina, A.V. Glyakina and N.V. Dovidchenko for assistance in preparation of the paper. This work was funded in part by the Russian Science Foundation (grant number 14-14-0536) for OVG, the programs "Molecular and Cellular Biology" (01201353567) for IVL, and grant MES RK Grant 2835/GF3 of the Ministry of Education and Science of the Republic of Kazakhstan for NKB and OVG.
REFERENCES
[PubMed Link]
[PubMed Link]
[PubMed Link]
[PubMed Link]
[PubMed Link]
[PubMed Link]
[PubMed Link]
[PubMed Link]
[PubMed Link]
[PubMed Link]
[PubMed Link]
[PubMed Link]
[PubMed Link]
[PubMed Link]
[PubMed Link]
[PubMed Link]
[PubMed Link]
[PubMed Link]
[PubMed Link]
[PubMed Link]
[PubMed Link]
[PubMed Link]
[PubMed Link]
[PubMed Link]
[PubMed Link]
[PubMed Link]
[PubMed Link]
[PubMed Link]
[PubMed Link]
[PubMed Link]
[PubMed Link]
[PubMed Link]
[PubMed Link]
[PubMed Link]
[PubMed Link]
[PubMed Link]
[PubMed Link]
[PubMed Link]
[PubMed Link]
[PubMed Link]
[PubMed Link]