All published articles of this journal are available on ScienceDirect.

High G+C Content of Herpes Simplex Virus DNA: Proposed Role in Protection Against Retrotransposon Insertion
Abstract
The herpes simplex virus dsDNA genome is distinguished by an unusually high G+C nucleotide content. HSV-1 and HSV-2, for instance, have GC contents of 68% and 70% respectively, while that of the host (human) genome is 41%. To determine how GC content varies with genome location, GC content was measured separately in coding and intergenic regions of HSV-1 DNA. The results showed that the 75 genes constitute a uniform population with a mean GC content of 66.9 ± 4.1%. In contrast, intergenic regions were found in two non-overlapping populations, one with a mean GC content (69.3 ± 4.6% n=32) similar to the coding regions and another where the GC content is lower (56.0 ± 4.9 n=30). Compared to other regions of the genome, intergenic regions with reduced GC content were found to be enriched in local GC minima, CACACA sequences and a primary target sequence (TTAAAA) for retrotransposition events. The results are interpreted to suggest that a high GC content is part of the way HSV-1 protects its genes from invasion by mobile genetic elements active during cell differentiation in the nervous system.
INTRODUCTION
The basic features of the herpes simplex virus (HSV-1) genome are now well known. Each virion contains a single molecule of dsDNA 152 kb in length. A total of 75 genes for known proteins are encoded with 69 of these present in a single copy and three in two copies each [1-3]. The genome is divided into two segments, L and S, which encode 57 (UL) and 12 (US) single copy genes, respectively. The L and S segments are separated by repeated genes, which are also found at the genome ends (Fig. 1). As HSV-1 DNA is replicated, the L and S segments invert with respect to each other yielding four genome “isomers” that are found in equal proportions in wild-type HSV-1 populations [4-6].

Schematic drawing of the HSV-1 genome. The genome is 152,261 bp in length and is divided into two segments, L and S.Each segment is organized with single copy genes (UL and US) in the middle and repeated genes (RL and RS) at the ends.
Among the genes encoded by HSV-1 are 43 ancestral or core genes present in all α-, β- and γ-herpesviruses [3, 7, 8]. All 43 are located in UL and most are conserved genes involved in vital virus functions such as entry of the virus into a host cell, DNA replication, capsid assembly, packaging DNA into the capsid and exit of the capsid from the host cell nucleus. The non-core HSV-1 genes include all US genes and highly divergent genes found at the segment ends [9]. Non-core genes encode proteins involved in lineage- or species-specific functions such as transcriptional transactivation, immune evasion and host cell recognition.
A high GC content is one of the most unusual features of the HSV-1 genome. HSV-1 and HSV-2 have GC contents of 68% and 70%, respectively, while the value for the host (human) genome is 41%. In contrast, 54.4 ± 11.5% is the average GC content for the 44 herpesviruses whose genome sequences have been determined (as of March 2007). Only eight herpesviruses, all α-herpesviruses, have GC contents of 68% or greater. In an effort to understand the reason for the high GC content, I have focused on HSV-1 and examined the extent to which GC content varies with position in the genome. The GC content was determined in the coding regions and in the regions between genes. The results have identified a group of intergenic regions whose GC content is reduced compared to the coding regions and to the genome as a whole.
MATERIALS AND METHODOLOGY
The HSV-1 DNA sequence (NC_001806) was extracted from public databases and manipulated with programs in GCG (version 11.1.3; Accelrys) run on a Dell PowerEdge 1950 server with dual 3 GHz Xeon cpu’s and 10GB of RAM). Composition was used to determine GC contents and FindPatterns+ was used to locate specific sequences. GC content in a sliding 120 bp window was determined with Artemis (Sanger Institute). Local GC minima were identified by visual inspection of the trace with all identified minima at least 10% GC lower than the adjacent background.
RESULTS
GC Content in Coding and Intergenic Regions
Coding and intergenic regions were extracted from the HSV-1 DNA sequence (NC_001806) using the editor function of GCG, and GC contents were determined with Composition. The 75 genes were found to have a mean GC content of 66.9 ± 4.1% with a range of 58.1% (UL1) to 82.9% (RL1; Table 1). Gene GC contents constituted a single population centered at the mean value as shown in Fig. 2 (black bars). The GC contents of gene subgroups such as essential and non-essential genes or core and non-core genes were examined and found not to differ significantly from each other or from the genome as a whole (Table 2).
GC Content of Coding and Intergenic Regions in the HSV-1 Genome
| Coding Region | Intergenic Region (rightward) | Coding Region | Intergenic Region (rightward) | ||||||
|---|---|---|---|---|---|---|---|---|---|
| Gene | Length (bp) | GC | Length (bp) | %GCa | Gene | Length (bp) | %GC | Length (bp) | %GC |
| RL1 | 747 | 82.9 | 1003 | 68.1 | UL36 | 9495 | 71.3 | 170 | 60.6 |
| RL2 (ex 2) | 1604 | 77.2 | 5588 | 67.8 | UL37 | 3373 | 69.3 | 448 | 68.3 |
| UL1 | 675 | 58.1 | Overlap | UL38 | 1398 | 71.3 | 517 | 61.5 | |
| UL2 | 1005 | 66.1 | 70 | 48.6 | UL39 | 3414 | 65.7 | 70 | 74.3 |
| UL3 | 708 | 63.4 | 160 | 46.3 | UL40 | 1023 | 61.4 | 221 | 53.4 |
| UL4 | 600 | 64.8 | 62 | 69.4 | UL41 | 1470 | 62.7 | 477 | 62.7 |
| UL5 | 2649 | 62.1 | Overlap | UL42 | 1526 | 66.8 | 111 | 55.0 | |
| UL6 | 2031 | 68.3 | Overlap | UL43 | 1305 | 72.4 | 280 | 62.1 | |
| UL7 | 890 | 66.1 | 200 | 55.0 | UL44 | 1516 | 67.8 | 187 | 57.8 |
| UL8 | 2253 | 70.4 | 238 | 72.7 | UL45 | 519 | 68.6 | 247 | 56.7 |
| UL9 | 2555 | 63.5 | Overlap | UL46 | 2157 | 71.1 | 84 | 67.9 | |
| UL10 | 1445 | 65.3 | 154 | 53.2 | UL47 | 2082 | 73.1 | 492 | 63.2 |
| UL11 | 291 | 66.6 | Overlap | UL48 | 1473 | 65.1 | 370 | 64.3 | |
| UL12 | 1881 | 68.5 | 60 | 66.7 | UL49 | 906 | 70.5 | Overlap | |
| UL13 | 1557 | 64.0 | Overlap | UL49A | 1276 | 68.9 | 18 | 50.0 | |
| UL14 | 660 | 65.9 | 106 | 73.6 | UL50 | 1116 | 66.7 | 153 | 48.4 |
| UL15 (ex 1) | 1029 | 64.3 | 127 | 60.6 | UL51 | 735 | 68.4 | 38 | 76.5 |
| UL16 | 1122 | 68.3 | 92 | 81.5 | UL52 | 3177 | 66.1 | Overlap | |
| UL17 | 2112 | 70.1 | 139 | 66.2 | UL53 | 1017 | 61.1 | 540 | 64.6 |
| UL15 (ex 2) | 1179 | 61.5 | 283 | 56.5 | UL54 | 1539 | 69.3 | 225 | 60.0 |
| UL18 | 957 | 65.5 | 354 | 68.1 | UL55 | 561 | 62.4 | 166 | 50.6 |
| UL19 | 4125 | 68.5 | 293 | 68.6 | UL56 | 705 | 66.2 | 3766 | 68.3 |
| UL20 | 669 | 61.3 | 587 | 60.3 | RL2 | 1604 | 77.2 | 1003 | 68.1 |
| UL21 | 1622 | 66.0 | 172 | 60.5 | RL1 | 747 | 82.9 | 1375 | 77.3 |
| UL22 | 2517 | 66.7 | 291 | 60.8 | RS1 | 3897 | 81.4 | 1537 | 74.6 |
| UL23 | 1304 | 63.5 | Overlap | US1 | 1297 | 64.9 | 94 | 61.7 | |
| UL24 | 1008 | 64.6 | 70 | 51.4 | US2 | 876 | 64.3 | 295 | 65.1 |
| UL25 | 1743 | 68.0 | 255 | 60.0 | US3 | 1446 | 63.6 | 78 | 61.5 |
| UL26 | 1908 | 71.4 | 343 | 47.8 | US4 | 717 | 63.7 | 272 | 59.6 |
| UL27 | 3023 | 66.5 | 9 | 77.7 | US5 | 279 | 65.9 | 411 | 58.6 |
| UL28 | 2358 | 69.7 | 305 | 66.6 | US6 | 1185 | 64.3 | 183 | 60.6 |
| UL29 | 3591 | 67.3 | 755 | 63.3 | US7 | 1173 | 65.6 | 287 | 56.1 |
| UL30 | 3708 | 65.8 | Overlap | US8 | 1653 | 66.5 | 419 | 69.2 | |
| UL31 | 921 | 65.6 | Overlap | US9 | 273 | 63.0 | 573 | 57.1 | |
| UL32 | 1791 | 68.0 | Overlap | US10 | 939 | 67.3 | Overlap | ||
| UL33 | 393 | 67.9 | 81 | 70.4 | US11 | 486 | 67.3 | 66 | 68.2 |
| UL34 | 828 | 67.1 | 107 | 67.3 | US12 | 267 | 65.5 | 1549 | 75.1 |
| UL35 | 339 | 65.8 | 146 | 48.6 | RS1 | 3897 | 81.4 | 1261 | 78.5 |
a Intergenic regions with reduced GC content are highlighted. Others are in the genome-like group
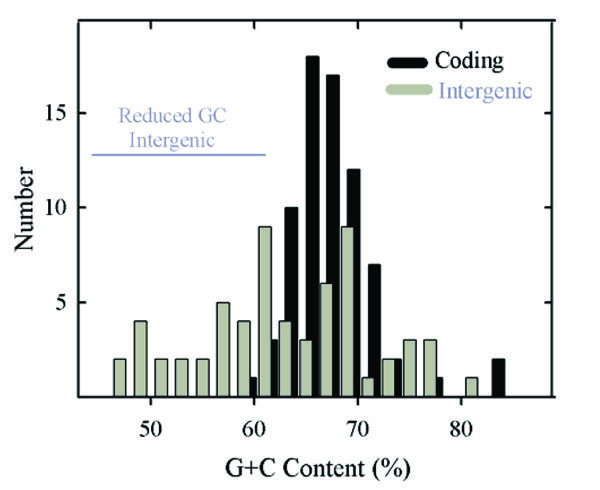
Histogram showing the GC content of HSV-1 genes (black bars) and intergenic regions (gray bars). Note the presence of a single population of coding region GC contents. Intergenic GC contents are considered to fall into two distinct groups, one coinciding with the population of genomic GC contents and the other with lower GC content. The two groups are identified as genome-like and reduced GC content,respectively. The 32 intergenic regions in the genome-like group have a mean GC content of 69.3% (range 62.1%-81.5%) while in the reduced GC content group the mean is 56.0% (30 regions; range 46.3%-61.7%; indicated by the horizontal gray line). Not represented in this analysis are the regions between the left genome end and RL1, and between the right genome end and RS1.
Mean GC Content of Selected HSV-1 Gene Groupsa
| Gene group | Mean %GC ± SD | P valueb |
|---|---|---|
| Essential | 67.3 ± 3.9 (n=34) | 0.55 |
| Non-essential | 66.5 ± 4.3 (n=38) | |
| Core | 66.7 ± 2.8 (n=43) | 0.39 |
| Non-core | 67.3 ± 5.4 (n=38) | |
| Beta kinetic class | 65.5 ± 2.8 (n=13) | 0.87 |
| Gamma kinetic class | 66.5 ± 4.3 (n=38) | |
| All UL | 66.6 ± 3.1 (n=58) | 0.91 |
| All US | 65.2 ± 1.4 (n=12) |
Compared to gene GC contents, intergenic regions were found to have a broader range of values, which extend from 46.3% (UL3-UL4) to 81.5% (UL16-UL17). Intergenic region GC contents were considered to form two non-overlapping populations as shown in Fig. 2 (gray bars). One coincided approximately with the distribution of gene GC contents while the other spanned a range of lower values. Further analysis was done with the two populations, which are identified as the genome-like GC content group (32 regions) and reduced GC group (30 regions), respectively (Table 1). Intergenic regions in the genome-like group had GC contents in the range of 62.1% (UL43)-81.5% (UL16); the range of the reduced GC group was 46.3% (UL3)-61.7% (US1).
Both genome-like and reduced GC intergenic regions are found throughout the HSV-1 genome (Table 1). In each case, however, there are areas of concentration. Reduced GC regions, for instance, occur preferentially at three sites, UL20-UL26, UL35-UL45 and US3-US7 that contain evolutionarily divergent genes (Table 1) [9]. In contrast, genome-like intergenic regions are enriched in two areas, UL16-UL20 and UL27-UL34, where evolutionarily conserved genes are concentrated (Table 1).Genome-like intergenic regions are also enriched between genes found near the genome ends and near the inter-segment junction.
The lengths of intergenic sequences vary from zero (i.e. overlapping genes) to several hundred base pairs (excepting very long intergenic regions that occur near the segment ends). Genome-like and reduced GC intergenic regions differ only slightly in average length, the values being 258.7±195.1 and 230±138.8, respectively. Many reduced GC intergene lengths occur in a single population with a mean of approximately 150 bp, while genome-like lengths are more evenly distributed in the range of 0-600 bp (Fig. 3).

Histogram showing the lengths of HSV-1 intergenic regions with genome-like GC content (top) and reduced GC content (bottom). Note the population of reduced GC intergenic lengths centered at ~150 bp. Excluded from this analysis are very long intergenic regions between RL1-RL2, RL2 (exon 2)-UL1, UL56-RL2, RS1-US1 and US12-RS1.
Local GC Minima, CA Repeats and TTAAAA Sites
Inspection of intergenic sequences revealed additional features that distinguish genome-like from reduced GC regions. For instance, measurement of GC content in a sliding window 120 bp in length showed that intergenic regions were often the sites of pronounced local minima in GC content. This feature is illustrated in Fig. 4, which shows the GC content in two regions of the genome. Local GC minima were found to occur, for instance, between UL42-UL43, UL43-UL44, and US5-US6, but not between US6-US7. The presence of local GC minima is indicated for intergenic regions with genome-like and reduced GC content in Tables 3 and 4, respectively. Of the 29 intergenic regions with reduced GC content, 19 were found to be sites of local GC minima while only 8 of 29 genome-like intergenic regions have the same feature.
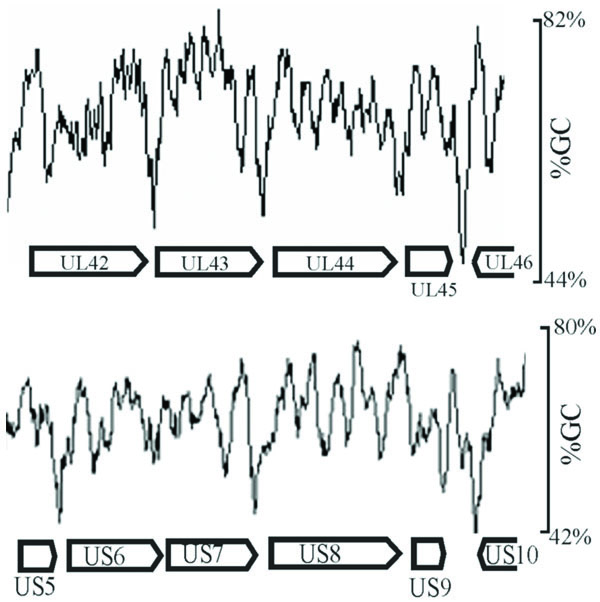
GC content as measured in a sliding 120 bp window shown in representative regions of the HSV-1 genome (between UL42-UL46 and US5-US10). Note the presence of pronounced local minima in GC content in certain intergenic regions such as UL42-UL43 and UL43-UL44, but not in others such as US6-US7.
Intergenic Regions with Genome-Like GC Contenta
| Intergenic Region | Local GC minb | CACACA | TTAAAA |
|---|---|---|---|
| RL1-RL2 | No | No | Yes (2) |
| RL2 (ex 2)-UL1 | Yes | Yes (2) | No |
| UL4-UL5 | No | No | No |
| UL8-UL9 | No | No | No |
| UL12-UL13 | No | No | No |
| UL14-UL15 (ex 1) | No | No | No |
| UL16-UL17 | No | No | No |
| UL17-UL15 (ex 2) | No | No | No |
| UL18-UL19 | No | No | No |
| UL19-UL20 | No | Yes | No |
| UL28-UL29 | No | Yes | No |
| UL29-UL30 | Yes | No | No |
| UL33-UL34 | No | No | No |
| UL34-UL35 | No | Yes | No |
| UL37-UL38 | No | No | No |
| UL39-UL40 | No | No | No |
| UL41-UL42 | Yes | No | No |
| UL43-UL44 | Yes | Yes | No |
| UL46-UL47 | No | No | No |
| UL47-UL48 | Yes | Yes | No |
| UL48-UL49 | No | No | No |
| UL51-UL52 | No | No | No |
| UL53-UL54 | No | No | No |
| UL56-RL2 | Yes | No | No |
| RS1-US1 | Yes | No | No |
| US2-US3 | No | No | Yes |
| US8-US9 | No | Yes | Yes |
| US11-US12 | No | No | No |
| US12-RS1 | Yes | No | No |
| Total | 8 | 8 | 4 |
| Total per 10,000 bp | 4.1 | 4.1 | 2.0 |
a Intergenic regions with genome-like GC content are those with GC contents in the range of 62.1%-81.5%
b Local GC minima are those identified by visual inspection of the GC content trace as defined in a sliding 120 bp window as shown in Fig. ((4)).
Intergenic Regions with Reduced GC Contentaa
| Intergenic Region | Local GC Minb | CACACA | TTAAAA |
|---|---|---|---|
| UL2-UL3 | Yes | No | No |
| UL3-UL4 | Yes | No | No |
| UL7-UL8 | No | Yes | No |
| UL10-UL11 | Yes | Yes | Yes (2) |
| UL15 (ex 1)-UL16 | >No | Yes (2) | No |
| UL15 (ex 2)-UL18 | Yes | Yes | No |
| UL20-UL21 | Yes | No | No |
| UL21-UL22 | No | No | No |
| UL22-UL23 | Yes | No | No |
| UL24-UL25 | Yes | No | No |
| UL25-UL26 | No | No | No |
| UL26-UL27 | Yes | Yes (3) | Yes |
| UL35-UL36 | Yes | No | Yes |
| UL36-UL37 | No | No | No |
| UL38-UL39 | Yes | Yes | No |
| UL40-UL41 | No | No | No |
| UL42-UL43 | Yes | Yes (2) | No |
| UL44-UL45 | Yes | No | Yes |
| UL45-UL46 | Yes | Yes | No |
| UL50-UL51 | Yes | Yes | No |
| UL54-UL55 | No | No | No |
| UL55-UL56 | Yes | Yes | No |
| US1-US2 | Yes | No | No |
| US3-US4 | No | No | No |
| US4-US5 | No | Yes | No |
| US5-US6 | Yes | Yes | Yes |
| US6-US7 | No | No | No |
| US7-US8 | Yes | No | No |
| US9-US10 | Yes | No | No |
| Total | 19 | 16 | 6 |
| Total per 10,000 bp | 28.4 | 23.9 | 9.0 |
a Intergenic regions with reduced GC content are those with GC contents in the range of 46.3%-61.7%.
b Local GC minima are those identified by visual inspection of the GC content trace as defined in a sliding 120 bp window as shown in Fig. ((4)).
The HSV-1 genome was examined for the frequency of two specific sequence motifs, CA repeats and TTAAAA sites. CA repeats are a common feature of the host (human) genome where they constitute 0.3% of the total sequence [10]. CA repeats occur predominantly as microsatellite DNA, but other functions have also been defined (see below). In the HSV-1 genome the sequence CACACA was taken as an overall measure of the CA repeat frequency. It occurs 79 times, a value in excess of the statistical expectation for a random 68% GC genome (49 see Table 5). Compared to the statistical expectation, CACACA sequences are enriched in intergenic regions; 17 are expected on a statistical basis and 24 are found (Table 5). Further, among the 24 intergenic CACACA sequences, most (16) are found in reduced GC regions (Tables 4 and 5).
CA Repeat and TTAAAA Retrotransposition Insertion Sites in the HSV-1 Genomea
| Sequences | Expecteda | Observed |
|---|---|---|
| CACACA (total) | 49 | 79 |
| CACACA (in genes) | 39 | 55 |
| CACACA (intergenic regions) | 10 | 24 |
| TTAAAA (total) | 5 | 28 |
| TTAAAA (in genes) | 4 | 18 |
| TTAAAA (intergenic regions) | 1 | 10 |
a Statistically expected sequence numbers were calculated based on both strands of the 152,261 bp HSV-1 genome with 68% GC content. A 16%; T 16%; G 34%; C 34%. Calculated values were rounded to the nearest whole number. The proportions of gene and intergene regions in the HSV-1 genome were taken as 79% and 21%, respectively [1, 2]
TTAAAA sequences were identified because these are prominent target sites for introduction of novel DNA by retrotransposition [11-14]. Such DNA inserts, including the long interspersed nuclear elements (LINE or L1 sequences) could affect the virus by inactivating it if incorporation was into a required gene. Retrotransposition could also affect the genome by introduction of a novel gene into the HSV-1 genome if incorporation follows reverse transcription of a cellular mRNA [15-18].
Analysis demonstrated that the HSV-1 genome contains a total of 28 TTAAAA sequences, a value greater than the number expected on a statistical basis (Table 5). Eighteen occur in coding regions and 10 in intergenic segments. Of those in intergenic regions, 6 are found in reduced GC and 4 in genome-like sequences (Tables 3 and 4. Of the four present in genome-like intergenic regions, all are in intergenic segments (at the ends of UL and in US) that contain evolutionarily divergent genes [9].
DISCUSSION
Intergenic Regions with Reduced GC Content
The high GC content observed for HSV-1 genes was fully expected in light of the high GC content of the genome as a whole and of the RL, RS, UL and US regions [2]. It was remarkable to notice, however, that coding region GC contents occur in a single, relatively narrow distribution (Fig. 2). In view of the diversity of HSV-1 genes, it might have been expected that different populations would be observed corresponding, for instance, to essential compared to non-essential genes, UL compared to US genes, core compared to lineage specific genes or early (beta) compared to late (gamma) genes (see Table 2). The existence of a single population indicates that coding region GC content is affected by factors that apply to all genes in a more or less equal way.
The greater diversity of GC contents in intergenic regions contrasts with the narrow distribution in the genes (Fig. 2). While some intergenic GC contents are similar to the genes and to the genome as a whole, there are others with lower GC contents. These are distributed over a wide range (~46%- ~61%) as shown in Table 1 and Fig. 2. The presence of a reduced GC population of intergenic regions suggests that evolutionary forces constraining other sequences apply differently in this case, and understanding the difference might be revealing about HSV-1 evolution, replication and pathogenesis.
High GC content in genes and the effects of L1 retrotransposition
I suggest the high GC content of genes may be related to the way HSV-1 adapts to retrotransposition events in neurons. HSV-1 enters the host by infecting epithelial cells, but it promptly traffics to neurons in local (trigeminal) ganglia where it establishes a latent infection that most often lasts for the lifetime of the host. The virus can be reactivated from neurons causing recurrent infections that are the hallmark of HSV-1 disease [19].
Neurons arise during development from progenitor cells that undergo a large-scale proliferation accompanied by generation of extensive cell diversity [20, 21]. Functioning neurons are selected from this highly diverse population that may initially include 1010 or more cell types. Selection is based on the activity of individual neurons. Those that become incorporated into active networks survive while the others are lost. It is estimated that no more than 15%-40% of post-mitotic neurons survive this experience-based selection process [22-23].
Although the mechanisms used for generation of neuronal cell diversity are not thoroughly understood, it is considered that retrotransposition by L1 elements plays a significant role [23]. The human genome contains approximately 105 L1 elements (non-LTR retrotransposons) that together account for ~15% of the genome. Active L1 elements are 5 kb-6 kb in length, but most L1s are inactive due to 5’ deletions, rearrangements or mutations in the open reading frames. Only 80-100 human L1s are considered to be retrotransposition competent, and of these ~10% are considered to be highly active [11, 16].
Two genes, an endonuclease and reverse transcriptase are encoded in L1 retrotransposons, and transposition involves reverse transcription of the L1 mRNA. Reverse transcription takes place at specific sites in the host cell genome where primers are created following single-strand cuts introduced by the L1-encoded endonuclease. L1 elements are introduced at these sites, which occur preferentially at TTAAAA and related AT-rich sequences [11-14]. As a rare event, the L1 reverse transcription machinery can act in trans on cellular mRNAs to introduce genes and processed pseudogenes at L1 retrotransposition sites [17, 18].
In the developing nervous system, L1 retrotransposition can, in principle, contribute to generation of cell diversity by any process in which insertion of exogenous DNA can affect gene expression. Introduction into an exon, for instance, could block protein expression while similar insertion events could affect promoter function, alternative splicing or other processes. Recent studies have demonstrated that L1 retrotransposition can promote other forms of genetic instability by way of the DNA repair machinery [11]. L1 retrotransposition has been observed experimentally in mice, in HeLa cells and in neural progenitor cells in culture [11, 24]. In the latter case, retrotransposition is found to be enhanced following downregulation of Sox2, a presumptive inhibitor of L1 mobility [24].
It is suggested that a high GC content is a part of the way HSV-1 protects itself from harmful effects that might result from L1 insertion, particularly insertion into genes. A high GC content is expected to minimize the number of TTAAAA and other AT-rich insertion sites present in genes and therefore to protect the genes from L1 retrotransposition events. Such protection would be particularly beneficial in the case of latently infected cells where the number of HSV-1 genomes is reduced compared to lytic infections [25]. The proposed high rate of L1 retrotransposition in neurons makes a high GC content particularly attractive for viruses such as HSV-1 that replicate and establish latent infections in neurons. It is consistent with this idea to note that of the 44 sequenced herpesviruses, all eight with GC contents of 68% or greater have a tropism for the nervous system. (The eight are: HSV-1, 68% HSV-2, 70% cercopithecine herpesvirus 1, 74% cercopithecine herpesvirus 2, 70% cercopithecine herpesvirus 16, 76% bovine herpesvirus 1 72% bovine herpesvirus 5, 74% pseudorabies virus, 73%.) In contrast, varicella-zoster virus (VZV) has a comparatively low GC content (46%) despite the fact that it becomes latent in neurons [26]. The ability of VZV to produce such infections despite a low GC content may be due at least in part to the diversity of ganglia in which latent infections occur. Latent VZV infections are found in ganglia along the entire length of the central neural axis [26] while those of HSV-1 and HSV-2 are concentrated in a more restricted number of ganglia (e.g. the trigeminal in the case of HSV-1).
Retrotransposition and Reduced GC Intergenic Regions
The existence of a population of intergenic regions with reduced GC content may also be related to retrotransposition events in neurons. Among the ways herpesviruses are thought to adapt to environmental change, on an evolutionary time scale, is by incorporating entire genes from the host cell genome. Evidence for such incorporations has been obtained most recently in the case of certain gammaherpesviruses [3, 27-29]. Because the incorporated genes lack introns, it is presumed that their incorporation occurs by way of a cDNA intermediate and L1 retrotransposition. In the case of HSV-1, the existence of intergenic regions with reduced GC content would be preferred as sites for gene insertion due to the greater probability that they will contain AT-rich L1 insertion sequences. Such regions would arise by default if their creation involved simply resisting the evolutionary pressure favoring increased GC content. Evidence for preference of TTAAAA sequences in reduced GC compared to genome-like intergenic regions is described in this study (Tables 4 and 5).Six TTAAAA sequences are found in 6688 bp of reduced GC intergenic DNA while 4 are found in 19,651 bp of genome-like intergenic sequence.
Experimental Tests
In the future it should be possible to test the idea expressed here that a high GC content is involved in resistance of the HSV-1 genome to invasion by L1 retrotransposons. As noted above, it is now possible to observe L1 transposition in cultured cells with the L1 element derived either from the cell genome or from a transfected plasmid [11, 24, 30]. Similar tests with herpesvirus-infected cells should demonstrate that L1 transposition into the virus genome occurs at a higher rate in low GC compared to high GC viruses. In HSV-1-infected cells, transposition should occur preferentially into reduced GC intergene regions and should avoid genes.
Local GC Minima and CA Repeats
Determination of the HSV-1 GC content in a 120 bp window was carried out as a supplement to measurements of the gene and intergene values. It was expected that intergenic regions might have a reduced GC content because of the measurements described above and also because intergenic regions are often the sites of AT-rich polyadenylation signals (AATAAA). In spite of such expectations, it was nevertheless noteworthy that GC minima were as pronounced and as focused on intergenic regions as the results demonstrated (Fig. 4). Intergenic regions with pronounced GC minima were found throughout the HSV-1 genome with a preference for reduced GC intergenic sequences as shown in Tables 3 and 4. Further information about the function of intergenic GC minima might best be pursued by examining the genomes of other viruses for this feature, and appropriate studies are now underway in our laboratory.
CA dinucleotide repeats are an abundant feature of the human genome where they account for ~0.3% of the total sequence [10, 31]. Most occur in microsatellite sequences, but others are involved in functions such as regulation of gene expression [32, 33], control of alternative mRNA splicing [34, 35] and mRNA stability [36]. Such functions depend on the ability of CA repeats to bind heterogeneous nuclear ribonucleoprotein L (hnRNP L [33, 36]). In the HSV-1 genome, one CACACA sequence has been identified within the thymidine kinase coding region (UL23) where it acts by way of hnRNP L binding to enhance mRNA polyadenylation and nuclear export of intronless mRNAs [36]. Others of the 55 coding region CACACA sequences may act in the same or a similar way. CACACA sequences are also found in intergenic DNA. These are located throughout the HSV-1 genome with most (16 of 24) occurring in reduced GC intergenic regions (Tables 3 and 4). Analysis of deletions in such CACACA sequences suggests itself as a promising way to identify their function.
ACKNOWLEDGEMENT
For contributions during the course of this investigation I gratefully acknowledge Michael Black, Fred Homa, Bill Newcomb Ann Campbell, Anna Maria Copeland, Lou Hammarskjöld and Jeffrey Brown. This work was supported by NIH award AI41466.
REFERENCES
[PubMed Link] [PMC Link]
[PubMed Link] [PMC Link]
[PubMed Link] [PMC Link]
[PubMed Link]
[PubMed Link]
[PMC Link]
[PMC Link]
[PubMed Link] [PMC Link]
[PubMed Link]
[PubMed Link]
[PubMed Link] [PMC Link]