All published articles of this journal are available on ScienceDirect.

Effects of Redox State on the Efficient Uptake of Cell Permeable Peptide in Mammalian Cells
Authors Info & Affiliations
Abstract
We investigated whether a cell-penetrating peptide linked via a disulfide bond to a fluorophore-labeled cargo peptide can be used to interrogate changes in cellular redox state. A fluorescence resonance energy transfer (FRET) pair was constructed so that the cargo peptide was labeled with fluorescein amidite (FAM) and the cell-penetrating peptide was attached to a quencher. Incubation of cells in culture with the FRET construct was visualized using live-cell, time-lapse imaging, which demonstrated earlier cellular uptake of the construct when cells were treated with the reducing agent n-acetylcysteine (NAC). The FRET peptide construct was easily detected in cells cultured in 96-well plates using a plate-reader. Treatment of cells with various classes of reducing or oxidizing agents resulted in an increase or decrease in FAM fluorescence, respectively. Changes in FAM fluorescence correlated significantly with redox-sensitive green fluorescent protein ratios in cells treated with hydrogen peroxide but not NAC. Detection of relative changes in cellular redox state was enhanced by the fact that uptake of the cell-penetrating peptide occurred more quickly in relatively reduced compared with oxidized cells. We conclude that cell-penetrating peptides coupled via disulfide bonds to detectable cargo is a novel and specific approach for assessment of relative changes in cellular thiol redox state.
INTRODUCTION
Cell penetrating peptides (CPP) exhibit unique properties for translocation across cellular membranes and non-endocytic uptake into mammalian cells, boosting the popularity of their possible applications in diagnostics and therapeutics [1]. Originally designed by Steiner and coworkers [2], Model Amphipathic Peptide (MAP) has amino acid sequence KLALKLALKALKAALKLA-NH2 and is thought to adopt an alpha-helical conformation where hydrophobic side chains align along one hemicircumference of the α-helix and positively charged side chains align along the opposite hemicircumference [3]. In the course of studying its interaction with the plasma membrane, investigators unexpectedly discovered the cell-penetrating property of MAP and paved the way for research into the mechanism(s) that govern peptide translocation into mammalian cells [4].
The mechanisms of cell peptide internalization and localization remain under active investigation. A cellular penetration mechanism was originally inferred to be nonendocytic based upon observed uptake at 0°C and following energy depletion [4]. However, in subsequent experiments, various maneuvers commonly believed to inhibit endocytosis yielded mixed results with evidence for and against endocytic uptake. Peptide uptake was decreased but not abolished after treatment of the cells with 2-deoxyglucose, motivating the inference that uptake is mediated by both energy-dependent and -independent mechanisms. Of the labeled cell-associated peptide, 50% was membrane bound, 30% was inserted into the membrane, and 20% was fully internalized [5]. Using giant lipid membrane vesicles with a lipid bilayer content similar to intact cells but without the ability to endocytose, Säälik and colleagues demonstrated that MAP uptake persists even without endocytosis [6]. Upon internalization, the subcellular distribution of MAP has been reported to include both cytosolic and nuclear compartments [7].
MAP and numerous other cell-penetrating peptides have received attention for their potential to shuttle proteins, nucleic acids, or small polar compounds across the plasma membrane [reviewed in 8-10]. MAP conjugated to polylysine was used to form multiplexes with siRNA against green fluorescent protein (GFP). The MAP-siRNA multiplexes were more effective at inhibiting GFP expression than Lipofectamine® siRNA transduction [11]. In another investigation, MAP was reversibly conjugated through a disulfide bond or irreversibly conjugated through a thioether linkage to peptide nucleic acid (PNA) sequences and tested for cellular uptake in a luciferase expression assay. Both reversible and irreversible linkages resulted in intracellular delivery of PNA. Interestingly, luciferase expression was enhanced by treatment with chloroquine, suggesting that a significant amount of MAP-conjugated PNA was sequestered in endosomes and that endosomal release improved nuclear uptake [12]. By comparison, Kenien and coworkers recently reported that cytochrome c reversibly linked to MAP via a disulfide bond was taken up by HeLa cells and partially transitioned from vesicles to cytosol, enabling apoptosis in response to treatment with MG132. Thioether-linked cytochrome c did not transition to cytosol and did not enhance apoptosis in response to MG132 treatment [13].
Cell-uptake kinetics of CPP have been explored using disulfide-linked cargo. In their study, Hällbrink and coworkers joined a cargo peptide consisting of CLKANL, N-terminally labeled with the fluorophore 2-aminobenzoic acid (Abz), to Cys-3-nitrotyrosine-MAP through a disulfide bond. The 3-nitrotyrosine moiety quenches emission from Abz while the disulfide bond remains intact. Upon entry into the cell, the disulfide bond is reduced, enabling Abz fluorescence and detection of internalization. Among four cell-penetrating peptides (MAP, penetratin, TAT, and transportan), MAP showed the fastest cellular uptake, and its internalized fraction reached 60% within 30 minutes of incubation [14].
In the present study, we adopted and modified the approach of Hällbrink and coworkers to determine whether MAP-mediated cellular delivery of disulfide-linked cargo varies with cellular redox state and whether this variation can be used to detect relative changes in cellular redox state. By conjugating MAP to 5(6) carboxytetramethylrhodamine (TAMRA)-cysteine at the N-terminus and the peptide CLKANL to fluorescein amidite (FAM) at the N-terminus, we created a disulfide-linked fluorescence resonance energy transfer (FRET) pair capable of separately interrogating cellular entry and disulfide reduction. This disulfide-linked CPP construct is hereafter referred to as “reductide.” Cellular internalization of C-MAP can be conveniently tracked by TAMRA fluorescence, which normally quenches FAM fluorescence unless the disulfide is reduced, instantaneously enabling this event to be monitored by FAM fluorescence – both in vitro and in vivo. We found that reductide detects relative changes in cellular redox state in living cells.
MATERIALS AND METHODS
Materials and Reagents
N-acetylcysteine (NAC), 1-chloro-2,4-dinitrobenzene (CDNB), l-buthionine sulfoximine (BSO), diamide, reduced glutathione (GSH), and oxidized glutathione (GSSG) were purchased from Sigma-Aldrich (St. Louis, MO, USA). Dulbecco’s Modified Eagle Medium™ (DMEM) and fetal bovine serum (FBS) were obtained from Invitrogen (Grand Island, NY, USA). Puromycin was purchased from Invivo-Gen (San Diego, CA). Plasmids (pLPCX) containing the gene for glutaredoxin-1 (Grx1) conjugated via a short linker sequence to cytosolic redox sensitive green fluorescent protein (Grx1-roGFP) were a gift from Dr. Tobias Dick (German Cancer Research Center {DKFZ}, Heidelberg, Germany). The Screen-Well™ REDOX library of 84 redox modifying drugs was obtained from Enzo Life Sciences (Farmingdale, NY).
Peptide Synthesis and Labeling
Reductide was synthesized using standard FMOC solid phase chemistry as two peptide moieties: cysteine conjugated MAP (Cys-Lys-Leu-Ala-Leu-Lys-Leu-Ala-Leu-Lys-Ala-Leu-Lys-Ala-Ala-Leu-Lys-Leu-Ala-amide) was conjugated to 5(6) carboxy-tetramethylrhodamine (TAMRA) through the N-terminus, and the non-cell penetrating peptide with the sequence Cys-Leu-Lys-Ala-Asn-Leu was conjugated to fluorescein amidite (FAM) through the N-terminus. These two sequences were joined through a disulfide bond. Peptides were purified by HPLC and analyzed by mass spectrometry.
Cells, Cultures, and Transfections
BJ and IMR90 human fibroblasts and H9c2 rat neonatal cardiomyocytes (ATCC, Manassas, VA, USA) were grown on 10 cm dishes, 6-well plates, or in a 96-well plate in DMEM plus 10% (v/v) FBS and supplemented with 2mM minimum essential amino acids (Invitrogen). Plasmids containing Grx1-roGFP under CMV promoter control with puromycin resistance genes were transfected into PLAT-E cells using Lipofectamine 2000. Retroviruses were harvested from the PLAT-E cell media at 24 and 48 hours and used to infect H9c2 cells, which were cultivated in the presence of puromycin (up to 4 μg/ml) for 15 population doublings. Stable expression was confirmed by fluorescence microscopy and western blot.
Reductide Assay in GSH Containing Buffer
Reductide was dissolved in 3% acetic acid to a concentration of 100 μM and immediately diluted 1:100 in tris-buffered saline (TBS) pH 7.4 containing reduced glutathione (GSH) plus or minus oxidized glutathione (GSSG) at the indicated concentrations. We confirmed that the pH of GSH-containing TBS remained unchanged at 7.4 following dilution of reductide. Reductide-containing GSH buffer was aliquoted into a 96-well plate with black sides and clear bottoms (Costar, Corning, New York). Reductide signal was read in a Synergy HT plate reader (BioTek, Winooski, VT, USA) at the indicated time points following addition to GSH-containing buffer using excitation and emission wavelengths of 485 nm/528 nm (FAM) or 530 nm/590 nm (TAMRA).
Fluorescence Microscopy
BJ fibroblasts in normal media were seeded onto 4-chamber glass cover slides (Lab-Tek, Rochester, NY, USA) at a density of 30,000 cells per chamber and allowed to attach overnight. For experiments involving redox modifying agents, cells were incubated in a humidified chamber at 37°C in 5% CO2 in normal media supplemented with NAC 4mM or CDNB 25 μM for 30 minutes just prior to microscopy. Media was then replaced with normal media supplemented with DAPI for 5 minutes. Media was then exchanged for normal media to which reductide was added to a concentration of 5 μM. Live cell imaging was performed using an Olympus FV1000 with cells in a stage incubator at 37°C in 5% CO2. Each image was acquired for 200 ms, and repeat imaging was performed for 4.5 hours.
Comparison between Reductide Signal and roGFP
H9c2 cells stably expressing cytosolic roGFP were seeded into a 96-well plate with black sides at a density of 8,000 cells per well in normal media and allowed to attach overnight. Cells were treated with n-acetylcysteine (NAC) or hydrogen peroxide (H2O2) at the indicated concentrations for 60 minutes. Cells were washed once with PBS followed by replacement with normal media. High throughput microscopy was performed using a BD Pathway High Content Bioimager 855. During imaging, cells were maintained at 37°C in a humidified chamber at 5% CO2. Images of each well were obtained following laser stimulation at 405nm and 488 nm. Ratiometric images were constructed using ImageJ (National Institutes of Health, Bethesda, Maryland) by dividing pixel by pixel the intensity following stimulation at 405 nm by the intensity following stimulation at 488 nm, following background correction for each. Immediately after imaging cells in a 96-well plate using the Pathway Bioimager as above, media was exchanged with normal media containing reductide 1 μM and incubated for 30 minutes at 37°C in 5% CO2 in a humidified chamber. Cells were then assayed on a fluorescence plate reader (Synergy HT; BioTek, Winooski, VT, USA).
Reductide Plate Reader Assay in Cells
BJ fibroblasts were trypsinized and re-plated in a 96-well plate (4,000-5,000 cells/well) in normal growth medium and allowed to attach overnight. Media was replaced with normal media supplemented with the chemical redox-modifying agent indicated in the “Results” section for the indicated duration of treatment. Cells were subsequently washed one time with PBS and media was replaced with normal media supplemented with reductide 1 μM. Cells were incubated at 37°C in 5% CO2 for the indicated time points followed by detection of reductide signal in a plate reader using excitation and emission wavelengths of 485 nm/528 nm.
In order to test the effect of redox modifying agents on development of fluorescent signal in cells which have already taken up reductide, cells growing in a 96-well plate were first incubated with reductide 1 μM for 60 minutes followed by washing with PBS and treatment with NAC or H2O2 for 60 minutes. Cells were then assayed in a fluorescent plate reader.
For comparison with monochlorobimane, IMR90 fibroblasts were seeded into a 96 well plate at a density of 50,000 cells per well and attached overnight. Cells were incubated for 60 minutes in media containing NAC or H2O2 at the indicated concentrations. Cells were washed twice in 200 μl of PBS. Monochlorobimane was used to assay reduced GSH content in half the wells using the Glutathione Assay Kit available from Sigma (CS1020, St. Louis, MO, USA), following the manufacturer’s instructions for use in live cells in a plate reader. At the same time, reductide was dissolved in the same assay buffer used for monochlorobimane treatment and added to half of the wells at a concentration of 1 μM. Fluorimetric readings were performed in a Synergy HT plate reader using excitation and emission wavelengths of 485 nm/528 nm for reductide and 390 nm/ 478 nm for monochlorobimane. Each cell condition was triplicated, and each experiment was repeated two times. Representative results are shown.
For comparison with Alamar Blue™ (Invitrogen, Carlsbad, CA), cells in a 96-well plate were washed with PBS followed by four hours of incubation with Alamar Blue diluted 1:10 in normal media according to the manufacturer’s instructions. Alamar Blue fluorescence was assayed in a plate reader using excitation and emission wavelengths 540 nm and 590 nm, respectively.
Flow Cytometry
IMR90 fibroblasts were seeded onto six 10 cm dishes at a density of 1.8x10⁶ cells and allowed to attach overnight. Three dishes were treated with H2O2 600 µM and another three with NAC 4 mM, each in normal media, for one hour. Cells were washed with PBS followed by incubation with reductide 1 µM in normal media for 3, 15, or 30 minutes. Cells were then washed again with PBS followed by trypsinization and collection in normal media without phenol red. Cell concentration was 106 per ml. DAPI was added at 1:500 dilution and cells were analyzed by flow cytometry for TAMRA and FAM fluorescence.
Statistical Analysis
Data are presented as mean +/- standard deviation. Statistical comparison of differences between two groups of data was carried out using a Student’s t-test. Differences between more than two groups of data were analyzed using one-way analysis of variance (ANOVA). P-values < 0.05 were considered statistically significant and P-values < 0.01 were considered highly significant.
RESULTS
Effects of GSH/GSSG on Reductide Redox-dependent Fluorescence
Because the emission signal of FAM is quenched by nearby TAMRA, reduction of the disulfide bond joining the two moieties of reductide triggers separation and achieves readable FAM fluorescence. Reductide was added to buffer containing a GSH pool at least a thousand-fold higher in concentration in order to mimic in vivo peptide reducing conditions. When assayed for fluorescence in a plate reader, in the presence of GSH, stimulation near FAM’s absorption maximum (485 nm) resulted in emission at 528 nm (Fig. 1A).
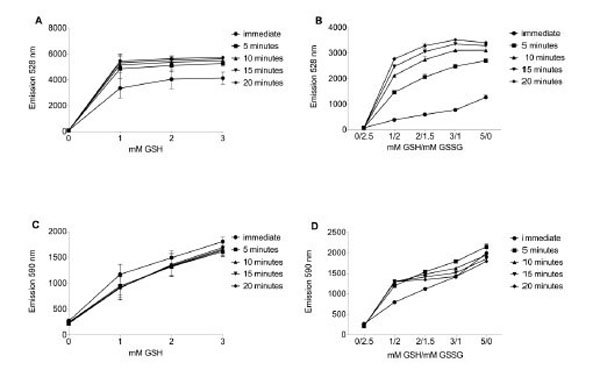
Reductide was dissolved in TBS pH 7.4 containing reduced glutathione (GSH) +/- oxidized glutathione (GSSG). In samples containing GSH and GSSG, the total glutathione pool (reduced glutathione plus two times oxidized glutathione) was 5 mM. Reductide concentration was 1 µM in all samples. Buffer was assayed in a fluorescence plate reader for FAM (485 nm excitation/528 nm emission) and TAMRA (530 nm excitation/590 nm emission). A. FAM emission intensity from TBS buffer prepared with reduced GSH. B. In the presence of GSH and GSSG, FAM emission intensity increases over time and in proportion to the GSH/GSSG ratio. The addition of GSSG to the buffer results in slower development of FAM signal and reduced maximal FAM emission intensity in comparison with buffer containing only GSH. Intensity of TAMRA emission is also dependent on GSH concentration (C) and GSH/GSSG ratio (D). Unlike FAM, TAMRA emission is insensitive to time (panels C and D).
To assess the effects of GSSG reduction potential on reductide fluorescence, we dissolved reduced and oxidized glutathione (GSH and GSSG) in TBS buffer such that the total glutathione pool was 5 mM (calculated as the concentration of GSH plus twice the concentration of GSSG) and dissolved reductide as before. The presence of added GSSG in the glutathione pool resulted in slower development of reductide fluorescence and a decrease in maximum fluorescence achieved by 20 minutes (Fig. 1B), suggesting that the rate of peptide reduction depends on the GSSG reduction potential as calculated using the Nernst equation. In the absence of GSH, there was no increase in emission intensity above initial background levels. In response to either dithiothreitol or NAC, reductide could also be reduced further by other thiol-containing reducing agents (data not shown). TAMRA emission intensity increased with increasing GSH concentration but not in a time-dependent manner, demonstrating lack of reciprocity with FAM’s time-dependent increase in emission intensity. This lack of reciprocity suggests a lack of dependence on the time-dependent reduction of reductide’s disulfide bond (Fig. 1C and 1D).
Distribution of Reductide During Live Cell Imaging
During live cell microscopy of TAMRA and FAM fluorescence, peptide uptake and cellular distribution appeared heterogeneous but essentially pan-cytosolic in BJ fibroblasts (Fig. 2). There was relative sparing of the nucleus by the TAMRA labeled cell-penetrating peptide moiety while the FAM labeled client peptide moiety appeared to distribute well within the nucleus. At later stages of reductide incubation, the FAM labeled moiety was expelled into the extracellular space via exocytic vesicles and distributed homogeneously throughout the extracellular media. The TAMRA labeled moiety was retained within cells. Both TAMRA and FAM signals appeared earlier in reduced cells (treated with NAC) than in oxidized cells (treated with CDNB), suggesting some dependence of cellular peptide uptake on cellular redox state.
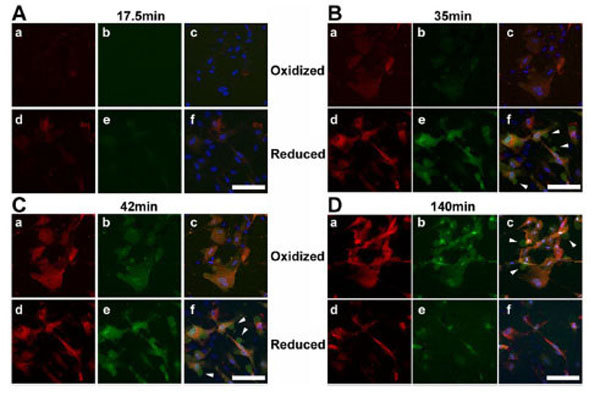
Live cell time-lapse confocal microscopic images (60X) of BJ fibroblasts incubated with reductide are shown. Cells were seeded into 4-chamber glass cover slides and allowed to attach overnight. The following day, the plates were pretreated with either CDNB 25 µM or NAC 4 mM for 30 minutes prior to washing with PBS and incubating with reductide 4 µM in normal media. TAMRA emission images are shown in red, FAM images are shown in green, and DAPI images are shown in blue. Arrows indicate exocytic vesicles containing FAM but not TAMRA.
Comparison of Reductide with roGFP
We generated H9c2 cells with stable redox sensitive green fluorescent protein (roGFP) expression that were seeded into a 96-well plate. They were pretreated with redox modifying agents (NAC or H2O2) followed by washing with PBS then assayed for roGFP activity using high-throughput microscopy. The microscopy assay was immediately followed by incubation with reductide in the same 96-well plate. This was followed by fluorescence plate reader assay. The ratio of roGFP emission intensities in response to excitation at 405 nm and 488 nm depends on GSSG reduction potential [15-18]. We were able to compare the average roGFP emission ratio for each well with the intensity of FAM emission for each well following incubation with reductide. There was significant correlation between roGFP emission ratio and reductide FAM signal in response to H2O2 treatment. There was no significant correlation between roGFP emission ratios and reductide signal following NAC pretreatment, however (Fig. 3).
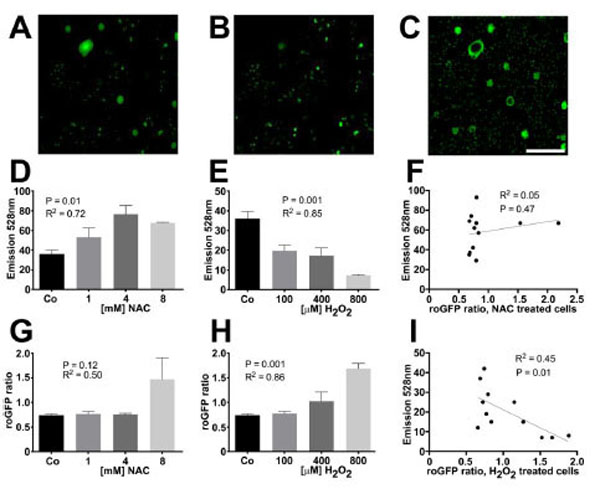
H9c2 cells stably expressing roGFP were seeded into a 96-well plate overnight. The following day, cells were treated with multiple concentrations of NAC, H2O2, or vehicle for 60 minutes. Live cell imaging was performed using high-throughput fluorescence microscopy. After image acquisition, cells were washed and reductide was added to each well at a concentration of 1 µM. Cells were incubated for 30 minutes followed by plate reader fluorescence detection (excitation/emission = 485 nm/528 nm). Fluorescence microscopy images following excitation at 405 nm and 488 nm were analyzed using Image J to determine the average ratio of emission intensities for each well. These ratios were compared well by well with the FAM signal from reductide incubation to determine the correlation between reductide and roGFP assessment of redox state. Representative fluorescence microscopy images of H9c2 cells expressing roGFP following excitation at 405 nm and 488 nm are shown (A and B). A ratiometric image following background subtraction is also shown (C). FAM emission signal following incubation of cells with reductide correlated with the concentration of redox modifying agent (NAC or H2O2) used to pretreat cells (D and E). RoGFP ratios correlated with the concentration of H2O2 used to pretreat cells but not with NAC (G and H). FAM emission intensity following incubation with reductide was significantly correlated with roGFP ratio following pretreatment with H2O2 but not NAC (F and I).
Cellular Uptake and Reduction of Reductide Varies with Cellular Redox State
BJ fibroblasts in 96-well plates were pretreated with various redox-modifying agents followed by washing, incubation with reductide, and assessment of fluorescence by plate reader. FAM signal increased in proportion to the concentration of NAC used in pretreatment (Fig. 4A) and decreased in proportion to the concentration of CDNB pretreatment (Fig. 4B). Following four hours of incubation with H2O2, FAM signal decreased in proportion to H2O2 concentration used (Fig. 4C). However, following twenty-four hours of treatment with H2O2, FAM signal was increased for BJ fibroblasts treated with 200-400 μM H2O2 (Fig. 4D) but decreased with higher doses. TAMRA signal was relatively constant for each well, consistent with the idea that TAMRA is not significantly quenched by FAM and consequently not much affected by reduction of reductide’s disulfide bond.
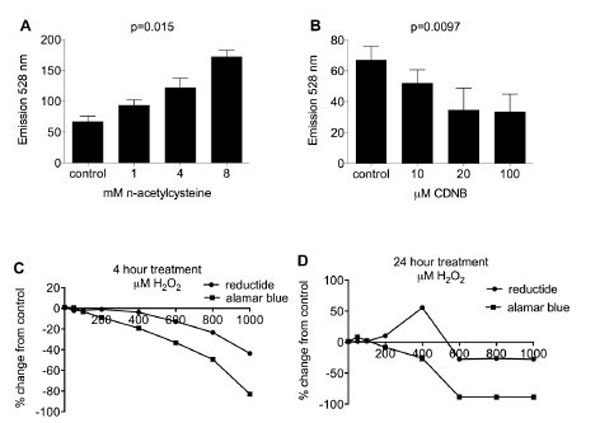
BJ fibroblasts in a 96-well plate were pretreated with NAC (A) or CDNB (B) for 30 minutes. Cells were washed twice with PBS followed by incubation with reductide 1 µM for one hour. Wells were assayed for FAM fluorescence. TAMRA fluorescence was also assayed but was constant for all wells tested, i.e. not dependent on dose of redox modifying agent used in pretreatment (data not shown). BJ fibroblasts were treated with various concentrations of H2O2 in cell media for (C) four hours or (D) 24 hours. Following treatment, cells were washed with PBS and incubated with reductide 1 µM in cell media for four hours. In parallel, H2O2M treated fibroblasts were also assayed with Alamar Blue (cell viability assay) diluted 1:10 in cell media according to the kit manufacturer’s instructions.
Glutathione is the most abundant intracellular redox buffering system. In order to test whether uptake and reduction of reductide is affected by glutathione status, BJ fibroblasts were treated with l-buthionine sulfoximine (BSO), an inhibitor of glutathione biosynthesis, or diamide, a thiol oxidizing agent that decreases the cellular GSH to GSSG ratio. Treatment with either agent resulted in a significant decrease in reductide FAM signal (Fig. 5), indicating that reductide uptake and reduction are affected by cellular glutathione status.
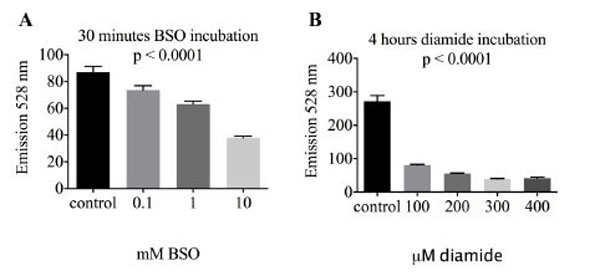
BJ fibroblasts were seeded into a 96-well plate at a density of 4,000 cells per well and allowed to attach overnight. The following day, cells were treated with (A) the glutathione biosynthesis inhibitor l-buthionine sulfoximine (BSO) or (B) the thiol oxidizing agent diamide in normal media also containing reductide 1 µM.
In order to test whether cellular uptake of reductide is affected by redox state, reductide fluorescence from BJ fibroblasts first incubated with reductide followed by washing and treatment with redox-modifying agents (NAC or H2O2) was compared with reductide fluorescence from fibroblasts first treated with redox-modifying agents and afterward incubated with reductide. FAM fluorescence was markedly decreased when cells were first incubated with reductide followed by redox-modifier treatment in comparison with cells first treated with redox-modifying agents followed by incubation with reductide (Fig. 6), indicating that not only intracellular reduction, but also initial cellular uptake of reductide must be affected by redox modification.
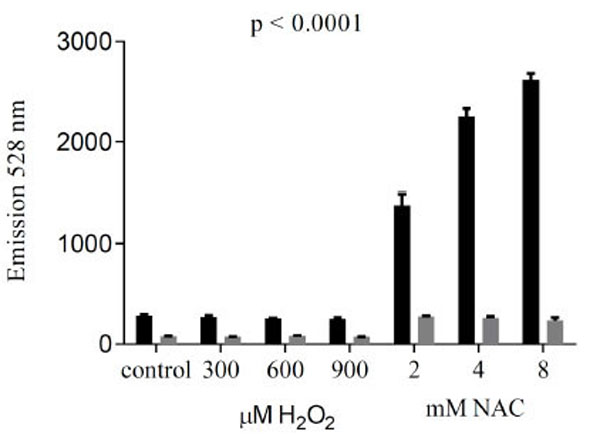
To compare the effects of cellular redox modification prior to incubation with reductide with modification after incubation with reductide, we incubated BJ fibroblasts first with reductide 1 µM for one hour followed by washing with PBS and subsequent treatment with redox modifying agents (NAC or H2O2) for 60 minutes. Plate reader fluorescence results for cells treated with redox modifying agents first followed by reductide incubation (black bars) are shown in comparison with cells first incubated with reductide and afterward treated with redox modifying agents (gray bars).
Comparison with Monochlorobimane
FAM signal following incubation with reductide of IMR90 cells pretreated with NAC or H2O2 showed dose-dependent changes in intensity (Fig. 7A). As observed in BJ fibroblasts, low doses of H2O2 treatment resulted in mild increases in FAM signal, while treatment with 600 µM resulted in a significant decrease in FAM signal. Signal from monochlorobimane did not show significant dependence on pretreatment dose or type of redox modifying agent (Fig. 7B).
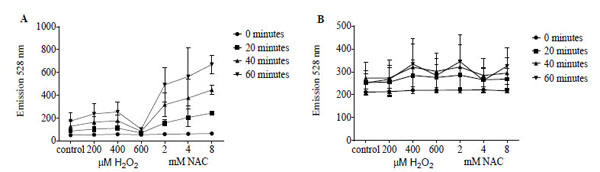
Reductide (A) is compared with monochlorobimane (B), which is non-fluorescent unless conjugated to low molecular weight thiols, in IMR90 fibroblasts following pretreatment with NAC or H2O2. Cells were seeded into a 96-well plate at a density of 50,000 cells per well and allowed to attach overnight. The following day, cells were incubated with vehicle, NAC, or H2O2 at the indicated concentrations for 60 minutes followed by washing and replacement of media with assay buffer containing monochlorobimane or reductide. Reductide or monochlorobimane signal was ascertained at the indicated time points of incubation.
Flow Cytometry
IMR90 fibroblasts incubated with reductide for various time periods exhibited a time-dependent increase in both TAMRA and FAM signals as detected by flow cytometry. TAMRA signal was strongest in cells pretreated with NAC 4mM (Fig. 8A). FAM signal was relatively weaker and exhibited less temporal resolution than TAMRA (Fig. 8B). This is consistent with cellular exportation of FAM-labeled CLKANL, which was observed during live cell microscopy. The time-dependent increase in TAMRA signal is attributable to continuous uptake of reductide over time. No increase in nonviable cells as observed by side-scatter or DAPI signal was seen in cells incubated with reductide vs. controls or in cells pretreated with H2O2.
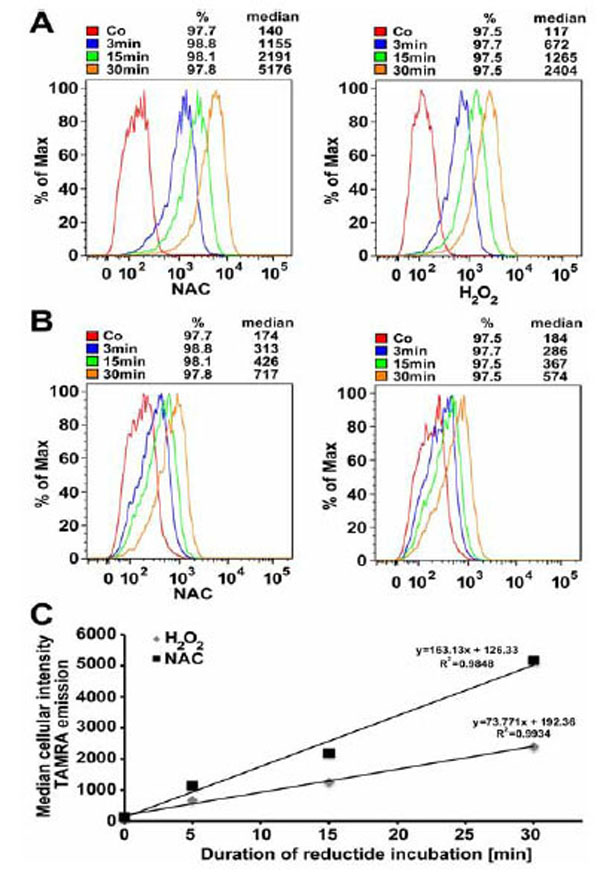
IMR90 cells were seeded into 10 cm dishes at a density of 1.8 x 10⁶ and allowed to attach overnight. The following day, cells were pretreated with NAC 4 mM or H2O2 600 μM for 60 minutes prior to peptide incubation. Median cellular TAMRA emission intensity as a function of time is shown (C).
Reductide Response to a Small Library of Redox Modifying Compounds
BJ fibroblasts were seeded into a 96-well plate at a density of 4,000 cells per well and allowed to attach overnight. The following day, cells were incubated in normal cell media supplemented with 50 μM of redox-modifying compounds from the Screen-Well™ redox library obtained from Enzo Life Sciences. Each redox compound was used to treat three wells for 24 hours. Afterward, cells were washed with PBS followed by incubation in reductide 1 μM dissolved in normal media for four hours. FAM signal from reduction of reductide’s disulfide bond was assayed in a plate reader. Most compounds in the library are classified as antioxidants. FAM signal was significantly increased in cells treated with 65 of the compounds or 77.4% of the library, and significantly decreased in response to treatment with nine compounds or 10.7% of the library. The remaining compounds did not result in a statistically significant change in FAM signal compared to vehicle treated cells. It should be noted that the screening conditions (50 μM concentration, 24 hour drug incubation) were not optimized for each drug individually. That many antioxidants can act as pro-oxidants if their concentration is sufficiently high is well known. Some antioxidative compounds such as GERI-BP002A and carvedilol resulted in a significant decrease in FAM signal following incubation at 50 μM for 24 hours. When retested at new concentrations, different results were obtained (Fig. 9), showing an increase in signal expected for reduction. Other representative results following treatment with 50 μM for 24 hours are shown in Table 1.
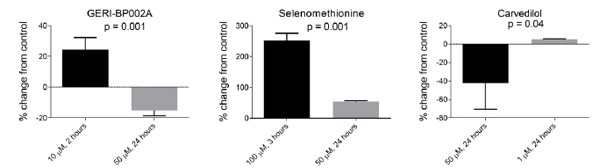
At concentrations of 50 µM, these compounds caused apparent oxidation as indicated by a decrease in FAM signal relative to vehicle treated cells. At lower concentrations, there was an increase in FAM signal consistent with reduction. By comparison, selenomethionine, an augmenter of thioredoxin reductase and glutathione peroxidase, caused a significant increase in FAM signal consistent with reduction at all concentrations tested.
Selected Results from Testing a Library of 84 Redox-active Compounds for Effect on Reductide
| Compound name | Class | % change from control | P value comparison with control |
|---|---|---|---|
| Ethoxyquin | Nonphenolic antioxidant | 155.4 | 9.5E-05 |
| Seratrodast | Quinone antioxidant | 134.9 | 9.1E-05 |
| Retinyl palmitate | Radical scavenger | 123.5 | 2.5E-03 |
| Idebenone | Quinone antioxidant | 120.8 | 3.3E-02 |
| -carotene | Radical scavenger | 111.1 | 3.8E-04 |
| Ebselen | GSH peroxidase mimetic | 77.2 | 0.00023 |
| Cumene hydroperoxide | Aryl hydroperoxide | -30.8 | 1.7E-03 |
| N-Ethylmaleimide | Thiol trap | -71.7 | 0.00001 |
BJ fibroblasts were seeded into a 96-well plate at a density of 4,000 cells per well and allowed to attach overnight in preparation for incubation with 50 µM of redox modifying compounds dissolved in cell media for 24 hours. Cells were subsequently washed with PBS and incubated with reductide 1.5 µM dissolved in cell media for four hours. FAM signal was assayed in a plate reader. The redox modifying compounds were obtained as an 84 compound library from Enzo Life Sciences. Percentage change in reductide signal in comparison with vehicle treated cells are shown for a subset of the redox modifying compounds.
Table 1. BJ fibroblasts were seeded into a 96-well plate at a density of 4,000 cells per well and allowed to attach overnight in preparation for incubation with 50 μM of redox modifying compounds dissolved in cell media for 24 hours. Cells were subsequently washed with PBS and incubated with reductide 1.5 μM dissolved in cell media for four hours. FAM signal was assayed in a plate reader. The redox modifying compounds were obtained as an 84 compound library from Enzo Life Sciences. Percentage change in reductide signal in comparison with vehicle treated cells are shown for a subset of the redox modifying compounds.
Interestingly, some antioxidative compounds caused cell death that was evidenced by cells rounding up and detaching. Despite this, incubation with these compounds yielded an increase in reductide signal consistent with reduction. Promethazine HCl and retinyl palmitate, for example, each caused cell shrinkage and detachment indicating cell death but resulted in 76% and 123% respective increases in reductide signal vs. control. Other antioxidants did not cause cell death and resulted in significant increases in reductide signal. Consequently, reductide signal is not an indicator of cell death. Further evidence for this fact is provided in Fig. (4D) where changes in reductide signal are discordant with changes in the cell viability indicator Alamar Blue in response to treating cells with 200 to 400 μM H2O2.
DISCUSSION
Reductide Uptake as Well as Reduction Depends on Cellular Redox State
The rate of development of FAM fluorescence following incubation of cells with reductide depends broadly on at least two composite steps: 1) cellular uptake and internalization and 2) reduction of the intramolecular disulfide bond. If differences in redox state only affected the rate of step 2, it is unlikely that reductide signal could be used to distinguish intracellular redox state in most living cells. This assertion is based upon the fact that the rate of development of FAM signal during incubation of reductide in TBS buffer containing various ratios of GSH/GSSG is rapid and not significantly different between 2 mM GSH/1.5 mM GSSG (GSSG reduction potential -164 mV at 25°C, using the Nernst equation) [19] and 5 mM GSH (GSSG reduction potential less than -200 mV). These values nearly span the range of GSSG reduction potentials for viable cells [20]. Consequently, intracellular reduction potential must affect step 1 if development of FAM signal is significantly different between viable cells with different redox states. Indeed, two of our experiments suggest that it does: 1) TAMRA signal, which does not require reduction of reductide’s disulfide bond for detection, occurs earlier by fluorescence microscopy in reduced cells compared with oxidized cells incubated with reductide; and 2) the development of FAM signal in a plate reader assay is attenuated and there is a smaller difference in signal between cells treated with reducing or oxidizing agents when incubation with reductide precedes treatment with redox-modifying agents. In this latter experiment, redox-dependent differences in rates of cellular uptake and internalization of reductide are controlled for by not modifying redox state until after reductide has been internalized. Redox dependent differences in development of FAM signal are much larger when incubation with reductide follows treatment with redox-modifying agents, suggesting that cellular uptake and internalization is an important step in redox-dependent development of FAM signal. This may partially explain why 2-deoxyglucose, an inhibitor of glucose-6-phosphate dehydrogenase and pro-oxidant [20], inhibits cellular uptake of MAP [4-5]. This property of MAP uptake offers potential for redox-dependent, targeted delivery of drugs or imaging agents using MAP-like constructs.
Pro-oxidants Activate an Antioxidative Response
Pretreatment of human fibroblasts with lower doses of H2O2 (200-400 μM) for 24 hours resulted in increased FAM fluorescence, indicating an increase in cellular reduction. In contrast, treatment with 600 μM or higher doses of H2O2 was associated with a decrease in FAM fluorescence. This finding may be explained by the fact that low dose H2O2 stimulates an antioxidative, and hence reductive, response that is overcome by higher doses of H2O2. A number of published investigations support the plausibility of this idea. For example, low and moderate doses of H2O2 in pulmonary endothelial cells caused nuclear accumulation of the redox-sensitive Nrf2 transcription factor and increased antioxidant response element (ARE)-dependent gene expression; in contrast, there was down-regulation of ARE-mediated gene expression and nuclear exclusion of Nrf2 at high dose H2O2 in the same cells [21]. Similarly, treatment of human umbilical vein endothelial cells with low dose H2O2 caused upregulation of thioredoxin-1 and inhibition of apoptosis after serum deprivation, whereas treatment with higher dose H2O2 resulted in no change in thioredoxin-1 expression but increased susceptibility to apoptosis [22]. Jarrett and Boulton reported that exposure of retinal pigment epithelial cells to sublethal doses of H2O2 caused upregulation of catalase, glutaperoxidase, Cu/Zn superoxide dismutase, and resistance to death caused by high dose H2O2 [23]. In V79 fibroblasts, exposure to low dose H2O2 caused upregulation of catalase by improving stability of its mRNA. This was mediated by activation of p38 mitogen-activated kinase [24]. In another report, exposure of V79 cells to low dose H2O2 resulted in increased GSH content, increased activity of Cu/Zn superoxide dismutase, catalase, and glutaperoxidase, and increased resistance to cell killing by H2O2 and cisplatin [25]. The oxidant dose range that is most likely to stimulate an overall antioxidative response is likely to vary by cell type and species [26-28].
Mechanism of Cell Penetration
Does the finding that cellular redox state affects cellular internalization of MAP shed any light on its mechanism of uptake? MAP uptake does not depend on concentration [29], and it does not wash out of cells [7]. Consequently, its uptake (or efflux) is not driven by a concentration gradient. Perhaps its uptake is driven by an electrical gradient. Due to the actions of the sodium-potassium ATPase and other ion channels, the intracellular space is more negatively charged than the extracellular space, and MAP, like many other cell-penetrating peptides, carries an overall positive charge. This means that nonendocytic translocation to the intracellular space decreases electrical potential energy. A number of reports indicate that redox state affects the trans-plasma membrane electrical potential through redox regulation of various potassium and calcium channels [30-32]. One recent study indicates that thiol reduction of potassium channels hyperpolarizes membrane potential [33]. Validation of this mechanism for MAP uptake is beyond the scope of this paper, but future work will examine whether manipulation of cellular electrical potential affects internalization of MAP.
We recognize that intracellular redox state remains dynamic and highly dependent on degree of cellular differentiation, density, and proliferative potential [20, 34]. Variations in redox state are linked to cell cycle progression [35-36]. Redox signaling plays a role in the pathogenesis of cardiomyopathy [37], cardiovascular disease [38], neurodegenerative disorders [39], and cancer [40], to name a few. Redox changes modulate apoptosis; depletion of reduced glutathione or moderate oxidative changes induce apoptosis [41], while more severe oxidation inhibits apoptosis, probably through oxidation of caspases, resulting in cell death by necrosis [42-43]. Redox-based delivery of pharmaceuticals thus has the potential to modify a variety of disease processes.
In conclusion, cellular uptake and reduction of model amphipathic peptide conjugated through disulfide linkage to a signal cargo varies by cellular redox state and can be used to interrogate relative redox changes in cells. Further work will explore whether a peptide disulfide conjugate can be used for redox-specific delivery of imaging agents or pharmaceuticals to either healthy or diseased tissues in vivo.
ACKNOWLEDGMENTS
This work was supported by the T32 in Cardiology Research Grant 5T32HL007576-27 of the National Heart, Lung and Blood Institute (SS), and 2009 NIH Director’s Pioneer Award 1DP1OD006438-02, VA Merit Review Award (IJB), and NHLBI 5R01HL074370-03 (IJB). Alison Ausman has provided excellent editorial assistance during preparation of this manuscript.
REFERENCES
[PubMed Link]
[PubMed Link]
[PubMed Link]
[PubMed Link]
[PubMed Link]
[PubMed Link] [PMC Link]
[PubMed Link] [PMC Link]
[PubMed Link]
[PubMed Link]
[PubMed Link]
[PubMed Link]
[PubMed Link] [PMC Link]
[PubMed Link] [PMC Link]
[PubMed Link]
[PubMed Link]
[PubMed Link]
[PubMed Link]
[PubMed Link]
[PubMed Link]
[PubMed Link] [PMC Link]
[PubMed Link]
[PubMed Link] [PMC Link]
[PubMed Link] [PMC Link]
[PubMed Link] [PMC Link]
[PubMed Link] [PMC Link]
[PubMed Link]
[PubMed Link]