All published articles of this journal are available on ScienceDirect.

Spectroscopic Studies of Tetracycline Interaction with Milk
Abstract
Introduction
The critical importance of controlling antibiotic residues in milk for human health necessitates advanced monitoring methods, as these residues can induce allergies, contribute to bacterial resistance, and disrupt gut microflora. Milk safety is key to preventing human health risks worldwide. The aim of the work is to identify consistent patterns and search for informative parameters and ranges in spectral diagnostics of tetracycline interaction with milk.
Methods
The absorption and luminescence spectra of milk were measured using a CM2203 spectrofluorimeter. Initial milk parameters were assessed with an “Expert Profi” ultrasonic analyzer, and antibiotic content was verified using “BIOEASY 4in1 BSCT” test kits.
Results
Analysis of milk contaminated with tetracycline across the 230-600 nm range revealed four distinct absorption peaks at 290, 324, 360, and 445 nm, with the peak at 445 nm exhibiting twice the intensity of the others. The integral and statistical parameters of the spectra were calculated, leading to the derivation of approximate dependencies of these parameters on antibiotic concentration. This process enabled the proposal of specific informative ranges and parameters for detecting and quantifying tetracycline. While the complex matrix of cow's milk renders the 230–310 nm and 310–340 nm ranges ineffective for analysis due to minimal parameter changes, the constructed dependencies identified two key diagnostic ranges: 340-400 nm and 400-520 nm.
Discussion
Approximate dependences of the spectrum parameters on the concentration of the antibiotic are obtained. Informative ranges and parameters for diagnosing the presence and tracking the concentration of tetracycline in milk are proposed.
Conclusion
These findings confirm that the 340-400 nm range (associated with nucleotide, protein, and flavonoid absorption) and the 400-520 nm range (associated with riboflavin absorption) are diagnostically informative, with the latter enabling qualitative detection of tetracycline based on parameters H, As, and Ex. The results pave the way for developing rapid, spectral-based methods for dairy product safety monitoring.
1. INTRODUCTION
Cow's milk, due to its nutritional properties, is among the most consumed products, playing a key role in the economy. The optimal composition of fats, carbohydrates, and proteins, along with its relatively low cost, makes milk a widely available product [1]. To obtain dairy products of high quality, it is essential to monitor the health of farm animals and actively treat them with modern and highly effective veterinary drugs. Veterinary drugs can be divided into several classes: anti-inflammatory, antiparasitic, antimicrobial, tranquilizers, growth stimulants, and others. They are also classified according to the degree of effectiveness, with narrow or broad spectrum [2]. Antimicrobials have been used to treat animals since the 1950s, with tetracyclines being a part of it. The tetracycline group is the main class of broad-spectrum antibiotics, which has been actively used in veterinary medicine for the treatment of a wide range of diseases of farm animals in recent years. However, after the use of veterinary drugs, animals can accumulate parent compounds of antibiotics, which can eventually end up in milk and meat, accelerating the evolution and spread of resistant microorganisms and disrupting fermentation processes in processing plants [3, 4]. The unreasonable use of antibiotics and the pursuit of economic gain by agricultural personnel can lead to serious consequences for consumers of such products [5]. Residues of veterinary drugs contribute to the development of such a serious and global public health problem as antibiotic resistance [6]. Moreover, a person eating such food products in the long term can significantly worsen their health, causing allergic reactions [7]. Additionally, such foods can cause aplastic anemia and lead to resistant intestinal bacteria in humans [8]. The teratogenic effect is also a common issue. The term “teratogen” applies to a drug or chemical that has a toxic effect on the embryo or fetus during a critical period of pregnancy. This results in a congenital malformation that affects the structural and functional integrity of the body [9]. Practically speaking, the control of potentially hazardous substances in milk and food products is connected both with the lack of scientifically substantiated maximum permissible levels of their content and with methodological difficulties. Therefore, there is a need for continuous improvement of sensitivity to minimum concentrations of existing antimicrobials and development of new methods to reduce the risk of unwanted substances entering food products [10]. It is critical to use proven and accurate analytical methods, whether commercial kits or laboratory tests, to ensure reliable results for producers, industry, and consumers. If a maximum allowable concentration is established for antibiotics, the screening analytical method shall be capable of determining antibiotic content within the maximum allowable concentrations [11]. Besides that, the screening analytical method shall exclude false-negative results, i.e., results that falsely indicate the absence of antibiotics when they are actually present. In addition, the screening analytical method shall not produce excessive false positive results that are subsequently confirmed as antibiotic-free results, despite the additional cost and time [12]. A considerable amount of research is being conducted in this area. Experimental and theoretical studies of tetracycline in milk and meat were carried out [13]. In the course of this work, a three-electrode sensitive sensor was developed for the detection of tetracycline residues in milk and meat samples using CO2 laser-induced graphene electrodes modified with gold nanoparticles and molecularly imprinted polymer as a synthetic biorecognition element. A fluorescent sensor for the diagnostics of danofloxacin in milk samples is under development [14]. This method can be used as a rapid test to estimate the content of unmetabolized drug residues in milk after treatment of cattle with antibiotics. Fourier transform infrared spectroscopy and ultraviolet spectroscopy were used to determine the presence of oxytetracycline in wastewater, milk, and meat products [15]. A portable test strip based on a fluorescent metal-organic europium structure was developed for rapid and visual detection of tetracycline in food samples [16]. A method for the fluorimetric determination of tetracycline antibiotics in animal products using cerium-based nanoparticles doped with boron and nitrogen is available [17]. Carbon nanotubes doped with aluminum were developed for the simultaneous selective detection of five tetracycline antibiotics, including minocycline, tetracycline, oxytetracycline, doxycycline, and chlortetracycline. Due to the bright blue fluorescence, the nanotubes showed excellent stability and did not change fluorescence intensity under different ionic strengths, in acidic or alkaline environments, under constant UV light illumination, and even during long-term storage at room temperature [18]. A new sensitive material was developed that allows the quantitative determination of tetracycline in milk [19]. A 2D artificial nano-enzymatic colorimetric sensor based on the blocking effect was developed for visual analysis of residual tetracycline content in milk. The sensor can be controlled from a smartphone [20]. A cucurbitaur-based potentiometric sensor was developed using high-performance liquid chromatography for the determination of chlortetracycline, doxycycline, oxytetracycline, and tetracycline residues in milk samples [21]. An electrochemical platform based on a single-stranded DNA aptamer is proposed for the selective detection of tetracycline with limits of 0.16 nM and 0.20 nM in buffer and cow's milk, respectively, which is more than 1000 times higher than the maximum residual level of 225 nM [22]. The possibility of using a coordination polymer based on cobalt trimesinate for the determination of tetracycline in various milk samples was investigated [23]. A dual fluorescent aptasensor based on mesoporous silica was developed for the simultaneous and quantitative determination of sulfadimethoxine and oxytetracycline residues in tissues of animal products, based on mesoporous silica, and the results were confirmed by high-performance liquid chromatography and had high reproducibility [24]. The study proposed an optimized chromatographic method followed by an enzyme-linked immunosorbent assay for the specific detection of tetracycline antibiotics in animal milk samples [25]. An autonomous photoelectrochemical aptasensor for cathodic detection of oxytetracycline based on a photoanode with a double Z structure and a two-electrode system was designed. In addition, the developed aptasensor showed good selectivity, reproducibility, and stability, which allows it to be used with real samples [26]. A study of metal- and pH-dependent binding of aptamers to tetracyclines was conducted, providing highly sensitive fluorescence detection [27].
The aim of the work is to identify consistent patterns and search for informative parameters and ranges in spectral diagnostics of tetracycline interaction with milk.
2. MATERIALS AND METHODS
2.1. Milk Used
For the studies, milk from a local agricultural company with a mass fraction of fat 2.5% and protein content of 3.42% was used. The acidity of the milk was 6.3 pH. Initial milk parameters were measured using an “Expert Profi” ultrasonic analyzer (“Laboratorika”, Russia). The milk was stored in a dark room at a room temperature of about 20°C. The milk samples were stirred prior to spectral measurements. This study is limited by the examined temperature range, owing to the effect of temperature on milk's luminescent properties, and by the storage time, because the addition of antibiotics alters its acidity.
2.2. Preparation of Antibiotic Solutions and Milk Contamination
At the first stage, a tetracycline suspension was prepared. Then, 100 cm3 milk samples were obtained with antibiotic concentrations of 0.001 μg/cm3, 0.003 μg/cm3, 0.004 μg/cm3, 0.005 μg/cm3 and 0.01 μg/cm3. The antibiotic content in milk was controlled with “BIOEASY 4in1 BSCT” test kits (“Shenzhen Bioeasy Biotechnology Co., Ltd”, China). These test systems are based on immunochromatographic analysis using colloidal gold. The test time is 10 minutes. Positive and negative control samples were prepared before the study. The storage time of the samples from the moment of their preparation until the start of measurements did not exceed 20 minutes. Long-term storage of milk in the refrigerator or after heat treatment may affect the results of the antibiotic residue testing, since beta-lactam and tetracycline molecules have been shown to be most sensitive to such heat treatments [28]. This emphasizes the importance of maintaining a short time interval between sample collection and testing, and of maintaining temperatures and storage conditions established by the approved methods.
2.3. Equipment and Methods of Spectral Measurements
The absorption and luminescence spectra of milk were measured using a CM2203 spectrofluorimeter (manufactured by Solar, Belarus) with a quartz cuvette with an optical path length of 10 mm. The spectrofluorimeter includes an optical system with a pulsed xenon lamp as a radiation source and a photomultiplier as a radiation receiver. The lamp operates in short pulses with a duration of 1.5 μs and a frequency of 25 Hz. A monochromator with a concave diffraction grating operating in the first diffraction order was used to distinguish the required spectral range. The absorption spectra η(λ) were measured in the range of 230–600 nm, the luminescence spectra at excitation wavelengths λe = 290 nm, λe = 324 nm, λe = 360 nm and λe = 445 nm and the recording ranges of 300–420 nm, 350–600 nm, 400–650 nm and 480–680 nm, respectively, using a methodology similar to a previous study [29]. The spectra scanning step was 2 nm, and the sensitivity of the photomultiplier was average. Repetition of measurements: 20-fold. The measurement uncertainty was calculated using standard formulas at a confidence level of p = 0.95. A sample size of 20 replicates yielded a relative error of less than 9% for asymmetry and below 3% for all other parameters. The measurement time allows us to meet the boundary conditions of the experiment. Data selection and processing were performed using established methodologies. The acquired spectral characteristics were corrected for instrumental distortions using Microcal Origin software.
2.4. Calculation of Spectrum Parameters
Based on the obtained spectral characteristics, the integral absorption capacity H was determined by the formula (Eq. 1):
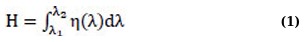
η(λ) is the spectral characteristic of the excitation (absorption) of milk, expressed in relative units (r. u.) of the photo signal of the measuring device, λ1-λ2 are the spectral boundaries of the integration range.
The statistical parameters of the spectra were also calculated. The mathematical expectation (average value) Mλ is determined by the formula (Eq. 2):
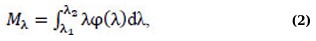
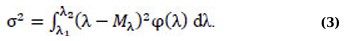
where φ(λ) is the probability density distribution, λ1, λ2 are the minimum and maximum values of the wavelengths of the photoluminescence measurement range. The calculation of this and subsequent statistical parameters was carried out in the Microcal Origin program. The variance σ2 is found by the formula (Eq. 3):
The numerical characteristic of the asymmetry is the central static moment of the 3rd order of μ3 (Eq. 4):
In practice, the asymmetry coefficient is used to assess asymmetry (Eq. 5):
For right–sided asymmetry, As> 0, for left–sided symmetry, As<0. The numerical characteristic of the steepness of the spectrum is an estimate of the central static moment of the 4th order µ4 (Eq. 6):
In practice, an artificially created value called kurtosis is taken as an estimate of the steepness coefficient Eλ (Eq. 7):
To obtain the equation for the numerical characteristics of the photoluminescence energy, it should be taken into account that each photon of photoluminescence has an energy related to the wavelength of radiation by the ratio (Eq. 8):
where Eph is measured in eV and λ is measured in nm. If the differential distribution function φ(λ) is known, then the total energy of the spectrum in the wavelength range is as (Eq. 9):
3. RESULT AND DISCUSSION
Cow's milk is a complex chemical liquid that consists of proteins, carbohydrates, minerals, etc. Cow's milk contains approximately 87% water, 4–5% lactose, 3% protein, 3–4% fat, 0.8% minerals, and 0.1% vitamins [30]. Triacylglycerides make up 95% of the lipid fraction in addition to diacylglycerides, cholesterol, phospholipids, and free fatty acids [31]. On the other hand, proteins are 80% casein (insoluble protein) and 20% whey protein (soluble protein) [32]. Milk is a good source of calcium and phosphorus, which are essential for growth, development, metabolism, and maintenance of the human body [33]. Besides that, they form large colloidal particles with casein proteins, called casein micelles, which increase the fluidity of casein molecules and facilitate the solubilization of phosphates and calcium [34].
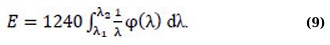
Depending on their solubility properties, antibiotics bind to certain fractions of milk, e.g., tetracycline interacts with fats, namely triglycerides and phospholipids, and with proteins, namely casein [35]. In accordance with maximum residue limits of pharmacologically (Regulation 2377/90 now replaced with the European Union Regulations 470/2009 and 37/2010), the permitted level of tetracycline in milk exceeds 0.005 mcg/cm3. The molecular structure of tetracycline is shown in Fig. (1) [36].
The mechanism of fluorescence sensors usually involves photoinduced electron transfer, electron energy transfer, and fluorescence resonance energy transfer [37]. The resulting radiation from these interactions helps to quantitatively analyze the target molecule in practical ranges. The mechanism of detection of target analytes using fluorescent probes can be studied by observing spectral changes in response to exposure to the analyte. Different interactions between the analyte and the phosphor lead to excitation energy and photoluminescence. These phenomena can cause changes in the intensity, wavelength, lifetime, or anisotropy of luminescence, which can be considered as potential signals to recognize the presence of analytes. The most commonly observed signal in analyte detection is an apparent change in the intensity of fluorescence emitted by the sensor material [38].
The molecular structure of tetracycline [36].
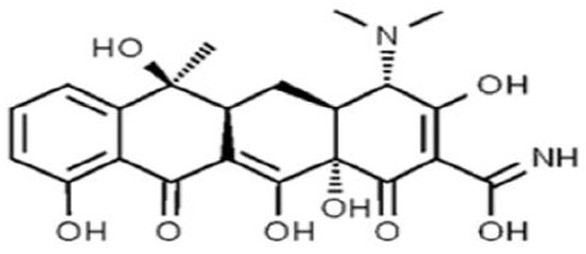
To study the absorption properties of milk and find a correlation between integral, statistical parameters, and concentration of tetracycline, at the first stage, plots of the η(λ) dependence in the near ultraviolet and visible range of 230–600 nm were obtained. The result is presented in Fig. (2).
Figure 2 shows four main absorption peaks: approx. 290 nm, 324 nm, 360 nm, and 445 nm. In the range of 522–600 nm, absorption is almost absent. For the 445 nm peak in the 400–520 nm range, the absorption intensity is maximum and exceeds the intensity of other peaks by 2.3–3.9 times. An increase in the absorbance of milk in the 230–310 range can also be observed with an increase in the tetracycline concentration.
As mentioned earlier, milk is a multicomponent substance and has a complex matrix where several variables are interrelated, so identifying specific compounds responsible for a particular absorption maximum can be a difficult task. For example, the 290 nm peak may be associated with the presence of tryptophan amino acid in milk, which is caused by the indole ring with a bond conjugation system [39].
The 324 nm peak may indicate the absorption of purines and pyrimidines, which are present in nucleic acids. These substances may be present in milk due to its proteins and cellular components, such as DNA and RNA. The 324 nm peak may also indicate the presence of vitamin A in milk [40]. The 360 nm peak may be associated with the presence of nucleotides, proteins, and flavonoids in milk [41]. The 445 nm peak may indicate the presence of riboflavin, namely vitamin B2, in milk [42].
The results of the milk-tetracycline interaction differ from the results of diagnostics with fluorescent sensors. Tetracycline has a broad absorption spectrum in the 200–400 nm range, and when matched with the emission spectrum of the fluorophore probe, internal fluorescence quenching may occur. The fluorescence quenching mechanisms mainly include structural collapse, fluorescence resonance energy transfer, internal filtering effect, and photoinduced electron transfer.
Spectral absorption characteristics of milk with tetracycline concentration:1 – 0 mcg/cm3 (unpolluted), 2 – 0.001 mcg/cm 3, 3 – 0.003 mcg/cm3, 4 – 0.005 mcg/cm3, 5 – 0.010 mcg/cm3.
As the concentration of tetracycline increases, the fluorescence intensity in milk solution gradually decreases, resulting in significant quenching due to the interaction between the antibiotic and the probing fluorophore based on the metal-organic framework material made of Yb-TCPP (ytterbium-tetra(4-carboxyphenyl)porphyrin) [43]. The same is observed for the metal-organic framework heterostructured composite at 370 nm absorption wavelength [44]. A correlation between fluorescence intensity and tetracycline concentration was also obtained using ZnCdSe/ZnS quantum dots [45].
Table 1 shows the integral and statistical parameters of the absorption spectra of tetracycline-contaminated milk.
It follows from Table 1 that the integral absorbance Η for all the investigated spectral ranges either increases or reaches saturation with an increase in the antibiotic concentration. The relative error in Η determination does not exceed 2.6%, and the smallest error in the 400–520 nm range does not exceed 0.72%. The highest error is for uncontaminated milk.
The mathematical expectation Mλ for all milk concentrations does not change, i.e., the “center of gravity” of the curves does not change; they are qualitatively the same. The same is for the dispersion σ2. The error in determining the mathematical expectation is independent of concentration and ranges from 0.02 to 0.04%, but for uncontaminated milk, it is 3–4 times higher (up to 0.12%). For the dispersion, the error also does not depend on the tetracycline concentration, but it is smallest in the 400–520 nm range.
For the excitation range of 230–310 nm (maximum λe=290 nm), left-sided asymmetry (As<0) occurs. For the 310–340 nm range (maximum λe=324 nm), curves are almost symmetrical, and only a slight left-sidedness is present. For curves in the 340–400 nm range (maximum λe=360 nm), right-handed asymmetry is observed, and for curves in the 400–520 nm range (maximum λe=445 nm), there is almost symmetry with a slight right-sidedness. Quantitative changes in asymmetry are either non-systemic or insignificant: for λe=324 nm, with a 10-fold increase in the antibiotics concentration, the asymmetry changes by 14%, and with contamination, by 24%. The error in asymmetry determination is the smallest for uncontaminated milk (not exceeding 3.2%).
| λ, nm | С, mcg/cm3 | 0 | 0.001 | 0.003 | 0.005 | 0.01 |
| 230 - 310 | Η, r. u. | 87 ± 1 | 93 ± 1 | 103 ± 1 | 123 ± 1 | 108 ± 1 |
| Mλ, nm | 277.2 ± 0.1 | 277.7 ± 0.1 | 277.7 ± 0.1 | 276.7 ± 0.1 | 278.3 ± 0.1 | |
| σ2 | 376 ± 3 | 371 ± 2 | 376 ± 2 | 385 ± 2 | 367 ± 2 | |
| AS | -0.367 ± 0.001 | -0.384 ± 0.007 | -0.395 ± 0.003 | -0.343 ± 0.011 | -0.414 ± 0.008 | |
| Ex | -0.669 ± 0.014 | -0.655 ± 0.012 | -0.649 ± 0.012 | -0.717 ± 0.014 | -0.622 ± 0.014 | |
| 310 - 340 | Η, r. u. | 39 ± 1 | 42 ± 1 | 46 ± 1 | 49 ± 1 | 49 ± 1 |
| Mλ, nm | 325.6 ± 0.1 | 325.6 ± 0.1 | 325.6 ± 0.1 | 325.6 ± 0.1 | 325.7 ± 0.1 | |
| σ2 | 66 ± 1 | 67 ± 1 | 67 ± 1 | 68 ± 1 | 68 ± 1 | |
| AS | -0.071 ± 0.001 | -0.088 ± 0.007 | -0.091 ± 0.006 | -0.091 ± 0.008 | -0.100 ± 0.006 | |
| Ex | -1.030 ± 0.003 | -1.034 ± 0.004 | -1.036 ± 0.003 | -1.053 ± 0.003 | -1.057 ± 0.004 | |
| 340 - 400 | Η, r. u. | 52 ± 1 | 57 ± 1 | 61 ± 1 | 66 ± 1 | 67 ± 1 |
| Mλ, nm | 365.4 ± 0.1 | 365.4 ± 0.1 | 365.2 ± 0.1 | 365.0 ± 0.1 | 365.0 ± 0.1 | |
| σ2 | 273 ± 1 | 272 ± 1 | 270 ± 1 | 268 ± 1 | 266 ± 1 | |
| AS | 0.339 ± 0.004 | 0.335 ± 0.005 | 0.347 ± 0.004 | 0.362 ± 0.004 | 0.358 ± 0.005 | |
| Ex | -0.966 ± 0.003 | -0.963 ± 0.003 | -0.948 ± 0.004 | -0.935 ± 0.003 | -0.927 ± 0.004 | |
| 400 - 520 | Η, r. u. | 277 ± 2 | 298 ± 1 | 303 ± 1 | 300 ± 1 | 297 ± 1 |
| Mλ, nm | 454.4 ± 0.1 | 454.5 ± 0.1 | 454.5 ± 0.1 | 454.3 ± 0.1 | 454.1 ± 0.1 | |
| σ2 | 531 ± 1 | 529 ± 1 | 527 ± 1 | 529 ± 2 | 528 ± 1 | |
| AS | 0.093 ± 0.003 | 0.084 ± 0.003 | 0.083 ± 0.003 | 0.083 ± 0.003 | 0.084 ± 0.004 | |
| Ex | -0.445 ± 0.006 | -0.436 ± 0.005 | -0.436 ± 0.004 | -0.435 ± 0.003 | -0.431 ± 0.006 | |
| 230 - 600 | Η, r. u. | 463 ± 4 | 499 ± 1 | 520 ± 1 | 546 ± 3 | 528 ± 3 |
| Mλ, nm | 401.9 ± 0.168 | 402.0 ± 0.335 | 399.0 ± 0.336 | 393.4 ± 0.461 | 396.4 ± 0.309 | |
| σ2 | 6095 ± 22 | 6020 ± 19 | 6121 ± 14 | 6448 ± 16 | 6119 ± 10 | |
| AS | -0.480 ± 0.006 | -0.485 ± 0.009 | -0.441 ± 0.008 | -0.337 ± 0.010 | -0.371 ± 0.007 | |
| Ex | -0.863 ± 0.003 | -0.872 ± 0.010 | -0.966 ± 0.011 | -1.097 ± 0.010 | -1.022 ± 0.007 |
Analyzing the Ex kurtosis, it is clear that in the 230–310 nm range all curves are flat-topped (Ex<0), and in the 310–340 nm range the flat-topped nature is more pronounced and increases slightly (by 2.6%) with increasing tetracycline concentration. For λe=360 nm, some pronounced top flatness of the spectra is also evident, decreasing by 4.2%. For λe=445 nm, all spectra are also flat-topped and do not change with different concentrations of antibiotics. The relative error is about 1%, and no systematic dependencies on the range and antibiotic concentration are evident.
To understand and analyze the dependence of integral and statistical parameters of the spectra on concentration, their approximation was performed. Approximations of H(C) in the 230–310 nm range do not show statistically significant results (determination coefficient R2 = 0.42). For other ranges, (Fig. 3A-C) shows plots of the Η(C) dependences for linear approximation and Boltzmann sigmoid approximation.
It follows from (Fig. 3) that the Η(C) dependence for the 310–340 nm range has a coefficient of determination for linear approximation R2l = 0.73, and for Boltzmann sigmoid approximation R2B = 0.99. For the 340–400 nm range: Η(C) R2l = 0.79, R2B = 0.98. For the 400–520 nm range, the Η(C) characteristic has a clear form of a curve with saturation, therefore R2l = 0.19, R2B = 0.96.
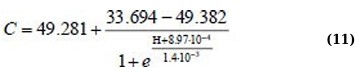
Η(C) regression equations for the 310 – 340 nm absorption range for linear approximation and Boltzmann sigmoid function (Eqs.10 and 11):

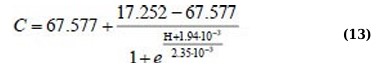
Η(C) regression equations for the 340 – 400 nm absorption range for linear approximation and Boltzmann sigmoid function (Eqs. 12 and 13):

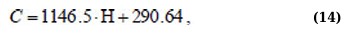
Η(C) regression equations for the 400 – 520 nm absorption range for linear approximation and Boltzmann sigmoid function (Eqs. 14 and 15):
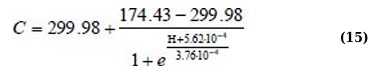
Although the approximation Eqs. (11, 13, and 15) are more complex, they allow us to more adequately and with high confidence describe the behavior of the dependencies Η(C).
Generally, the results of milk interaction with tetracycline, with the direct measurement of the absorbance proportional to the photoluminescent signal, show an increase in Η with increasing concentration, in contrast to the measurement of luminescent properties using fluorescent sensors, where the signal decreases due to the luminescence quenching [43-45]. It shall also be noted that sensors with fluorescent probes are more expensive, destructive, and require complex sample preparation with chemicals (trichloroacetic acid, etc.).
An approximation of the dependence of statistical parameters of the spectra was performed. Figure 4A-C shows plots of the dependence of statistical parameters for some ranges of milk absorption spectra on tetracycline concentration.
Figure 4 shows that the Ex(C) dependence for the 310–340 nm absorption range is decreasing and has R2 > 0.8, indicating the reliability of the model. The σ2(С) dependence for the 340–400 nm range also has a decreasing nature, with R2 > 0.9 On the contrary, the Ex(C) dependence for the 340–400 nm range has an increasing character with R2 > 0.7 For the obtained dependencies, the regression equations for calculating the quantitative content of tetracycline in milk are presented below.
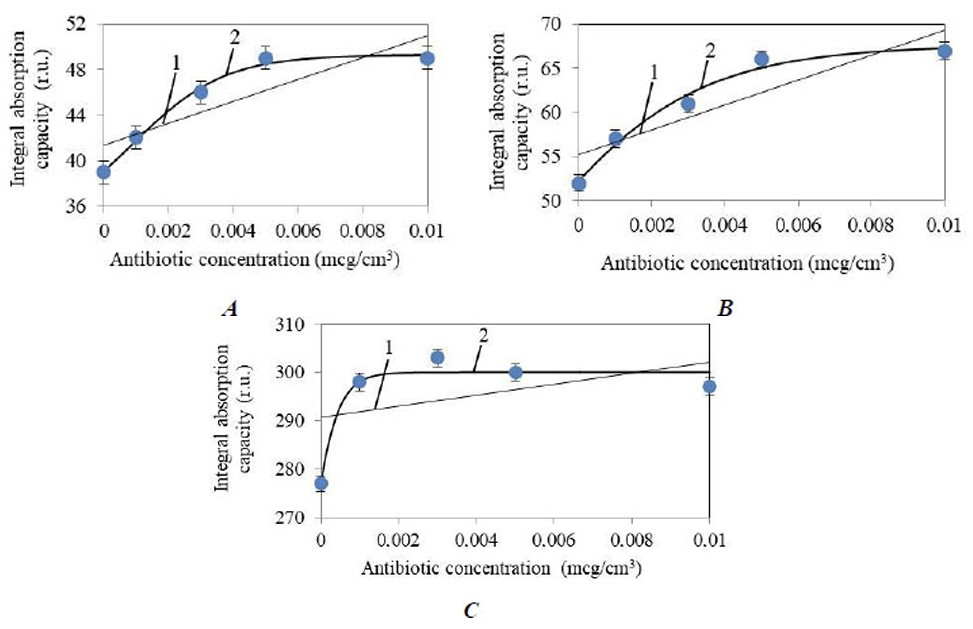
Dependence graphs of H(C) for absorption ranges: (A) 310 – 340 nm, (B) 340 – 400 nm, (C) 400 – 520 nm.
1 – Linear approximation, 2 – Boltzmann sigmoid approximation
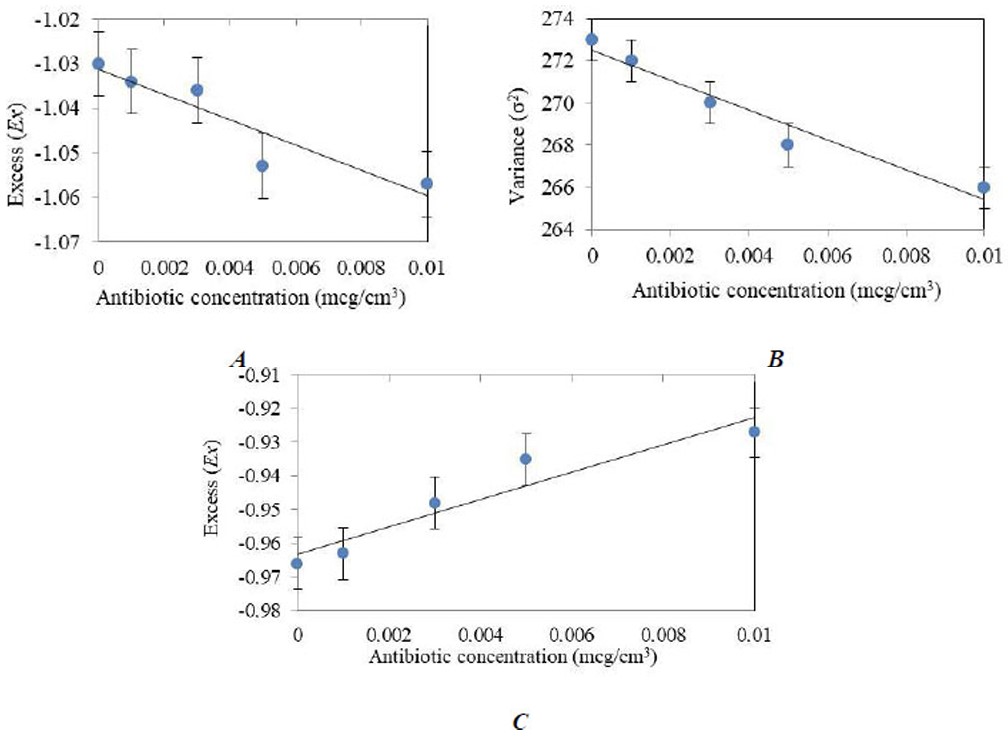
Graphs of the dependences of statistical parameters on the concentration of tetracycline in milk: (A) Ex(C) for the absorption range 310 – 340 nm, R2 = 0.86, (B) σ2(C) for the range 340 – 400 nm, R2 = 0.95, (C) Ex(C) for the range 340 – 400 nm, R2 = 0.90.
Graphs of the dependences of statistical parameters on the concentration of tetracycline in milk for the absorption range of 400 – 520 nm: (A) As(C), R2 = 0.99, (B) Ex(C), R2 = 0.87.
Regression equation Ex(C) for the absorption range of 310 – 340 nm (Eq. 16):

Regression equation σ2(С) and Ex(C) for the absorption range of 340 – 400 nm (Eqs. 17 and 18):


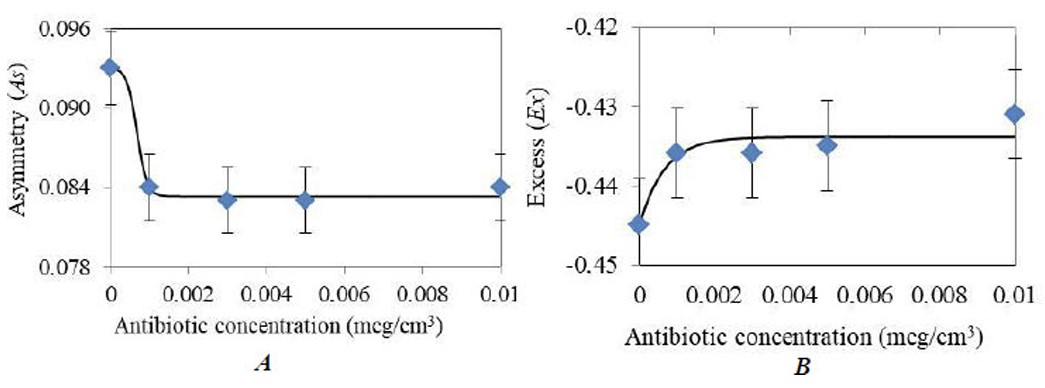
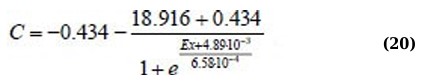
For the 445 nm wavelength radiation excitation, high reliability of approximation was obtained by using the Boltzmann sigmoid for asymmetry and kurtosis. Figure 5A-B shows graphs of the dependences of statistical parameters on the concentration of tetracycline in milk for the absorption range of 400 – 520 nm.
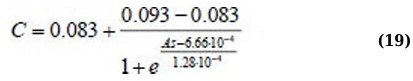
It follows from (Fig. 5) that the values of asymmetry and kurtosis for milk without antibiotics differ significantly from the values of milk with an antibiotic. Regression equations for As(C) and Ex(C) for the 400 - 520 nm absorption range (Eqs. 19 and 20):
For other statistical parameters and ranges, the approximation is not statistically valid, and the dependencies themselves are not systemic.
Thus, the 230–310 nm spectral range is not informative in terms of milk-tetracycline interaction due to the low accuracy of approximation and the lack of systematicity in the dependence of the spectrum parameters on the antibiotic concentration. In the 310–340 nm range, the change in kurtosis is only 2.6%, although there is statistical reliability of the Ex(C) dependence approximation. It is more reasonable to use the 340–400 nm excitation range due to the smallest error in determining asymmetry and kurtosis, as well as the high reliability of the linear approximation of the σ2(C) and Ex(C) dependencies in the entire range of concentration changes. However, the changes in dispersion and kurtosis are only 2.6% and 4.2%, respectively. The 400–520 nm spectral excitation range is also informative, being characterized by the smallest error in determining the Η, Mλ, σ2 values and the highest absolute value of the integral absorbance. In the dependences Η(C), As(C), and Ex(C), a sharp transition between uncontaminated and contaminated milk is evident, which can be approximated by the Boltzmann sigmoid. For asymmetry, the greatest decrease is observed with contamination (by 11%).
CONCLUSION
(1) The qualitative parameters of the excitation spectra of milk (expectation value, dispersion, asymmetry, kurtosis) practically do not change in the presence of tetracycline and not depend on its concentration, except for the kurtosis value at λe=324 nm and λe=360 nm. The integral quantitative parameters Η change.
(2) Relative errors of the determined integral parameters do not exceed 2.5%, with the highest error for milk without antibiotics. For statistical parameters, the maximum error ranges from 0.12% for expectation to 8.8% for asymmetry.
(3) For kurtosis and dispersion in the 310–340 nm and 340–400 nm ranges, it is possible to obtain a statistically reliable linear dependence on the tetracycline concentration. For integral absorbance, the dependences on concentration, although systemic, are nonlinear with the determination coefficient for the Boltzmann sigmoid R2=0.96–0.99.
(4) The informative excitation ranges are 340–400 nm, associated with radiation absorption by nucleotides, proteins, and flavonoids, and 400–520 nm, associated with riboflavin absorption. In the 400–520 nm range, qualitative diagnostics of the presence of tetracycline in milk for H, As, and Ex is possible.
AUTHORS’ CONTRIBUTIONS
The authors confirm their contributions to the paper as follows: M.B. and I.E.: Conceived and designed the study; I.E.: Collected the data; M.B. and I.E.: Performed the analysis and interpreted the results; and M.B. and I.E.: Drafted the manuscript. All authors reviewed the results and approved the final version of the manuscript.
LIST OF ABBREVIATIONS
| UV light | = Ultraviolet Light |
| DNA | = Deoxyribonucleic Acid |
| RNA | = Ribonucleic Acid |
AVAILABILITY OF DATA AND MATERIALS
All the data and supporting information are provided within the article.
ACKNOWLEDGEMENTS
The authors are grateful to the Federal Scientific Agroengineering Center VIM.